Home · Research tools · InvestingPro review
On this page
Two products share this name. This review covers InvestingPro, the premium subscription of Investing.com, the financial markets platform founded in 2007. An unrelated portfolio management product is also called InvestingPro and is what appears on several software review directories. Poor ratings you may have seen on those sites refer to the other product.
Every figure in this review traces to a dated verification record, published in full so it can be checked line by line: the InvestingPro verification record. Session of 10 August 2026, next scheduled re-check 8 November 2026. It also lists the widely circulated figures we deliberately do not publish, and why. What the subscription costs is a separate question with no single answer, so the price we were shown in four countries on one day is recorded on the InvestingPro price page. Five of Investing.com's own marketing figures are put against what we counted on the claims checked page. The same counting method applied to the nearest free competitor is on the Stock Analysis free tier page, and three free tiers are counted side by side on the stock analysis tools comparison.
Verdict
A genuine research tool rather than a signal service. InvestingPro puts institutional-style valuation data at a consumer price, and its value to you depends almost entirely on one question: do you actually analyse individual companies before you buy them?
Two tiers, Pro and Pro+ · priced by country and currency, so the figure is your checkout screen's, not ours · non-refundable, renews at the standard rate · checked 10 Aug 2026
Subscribe to InvestingProPaid link. The rating is 4.1, not 5, and it was set before the arrangement · 10 Aug 2026
What InvestingPro actually is
InvestingPro is the premium subscription of Investing.com. The free site gives you quotes, charts, news and an economic calendar. The subscription adds the layer on top: valuation models, a financial health scoring system, an AI research assistant, AI-built stock strategies, and a screener with a metric catalogue spanning ten categories.
That distinction matters more than it sounds. Most of what people recognise as Investing.com is free and stays free. You are not paying for prices. You are paying for an opinion about whether those prices are reasonable.
Two tiers exist. Pro covers the core valuation and health tooling. Pro+ adds depth, though during testing the historical financial data still stopped at ten years on Pro+, a limit WarrenAI states itself when you push it.
Who this is for, and who should skip it
Worth considering if you
- Analyse individual companies before buying them
- Hold a concentrated portfolio where one position matters
- Want a valuation cross-check against your own thesis
- Invest outside the US and struggle to find non-US fundamental data
- Already pay for two or more research tools
Skip it if you
- Buy index funds and rebalance once a year. Nothing here changes that decision.
- Need real-time quotes. This is a research tool, not a trading terminal.
- Want picks you can follow without thinking. The strategies exist, but treating them as instructions rather than inputs is how people lose money.
- Are new to investing. It assumes you know what EV/EBITDA is and why it matters.
I have invested privately for fifteen years, and the honest test is simple: have you ever opened a company's ten-year revenue history before buying the stock? If the answer is no, this subscription will sit unused.
The research workflow, tested on one stock
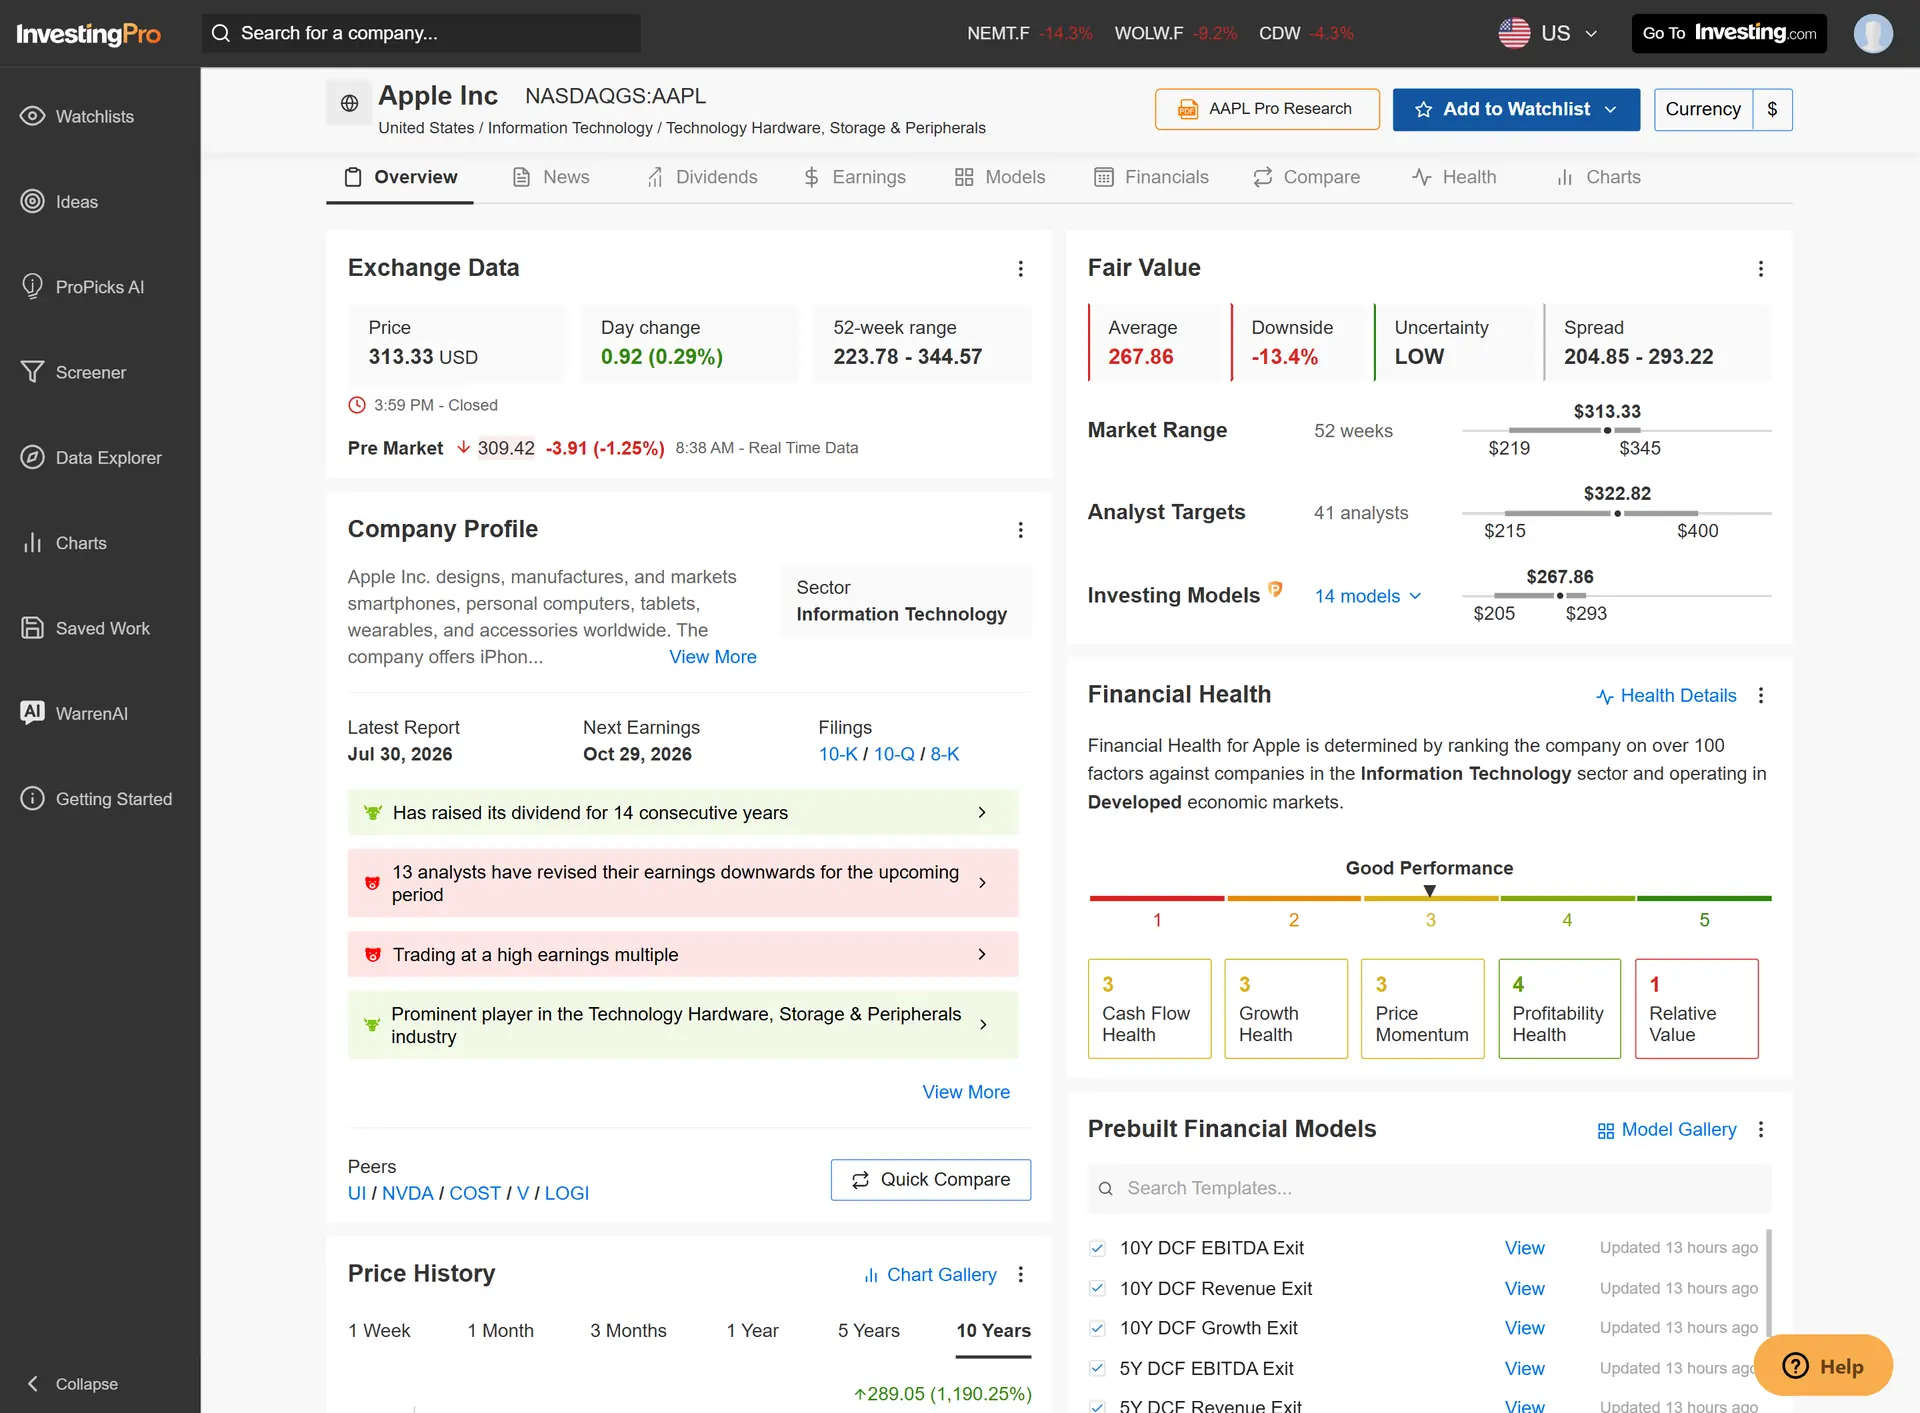
Everything below comes from a single session on 10 August 2026, following Apple through the full workflow. Apple was chosen because most readers already hold a view on it, which makes it possible to judge whether the output is sensible rather than merely impressive.
On the prices you will see. Apple traded between $313.33 and $306.24 across the session. Where screenshots disagree by a few dollars, that is a moving market, not inconsistent data. Every figure here carries the time it was taken.
Fair Value · is it cheap or expensive
Fair Value returned $267.86 against a market price of $306.31, implying the stock was overpriced by roughly 12.5 percent, with uncertainty rated low.
What makes the feature useful is that the number is not presented as a single truth. Open it and you see the fourteen individual models behind it, each with its own answer.
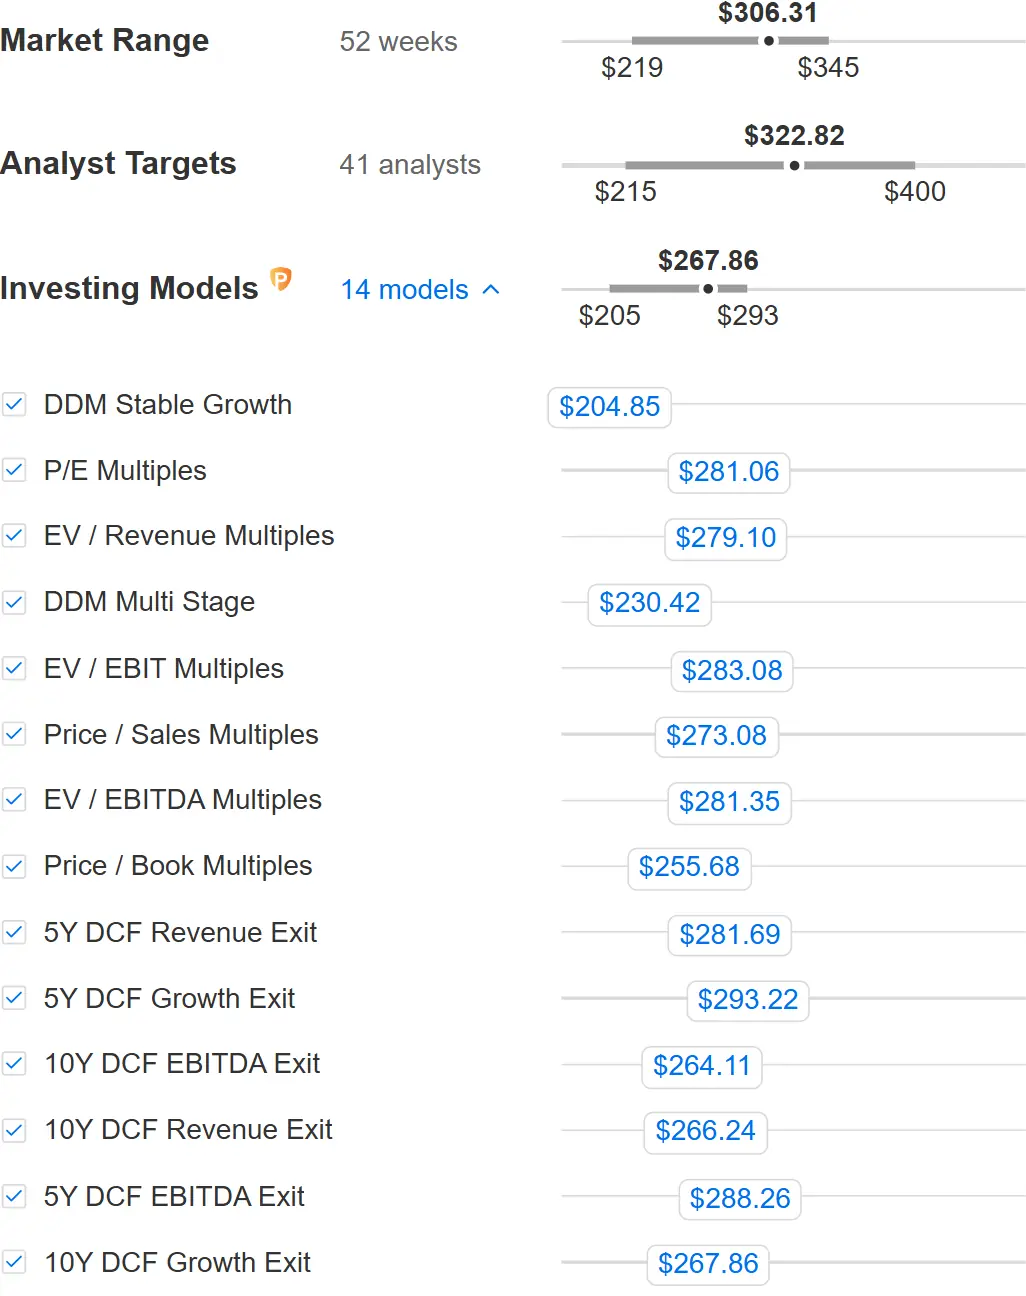
The spread is wide. DDM Stable Growth said $204.85. A five-year DCF with a growth exit said $293.22. That is an $88 gap, and the headline figure is an average of models that substantially disagree. It is a real limitation, but one the tool shows you rather than hides. Most valuation products publish one number and leave you to trust it.
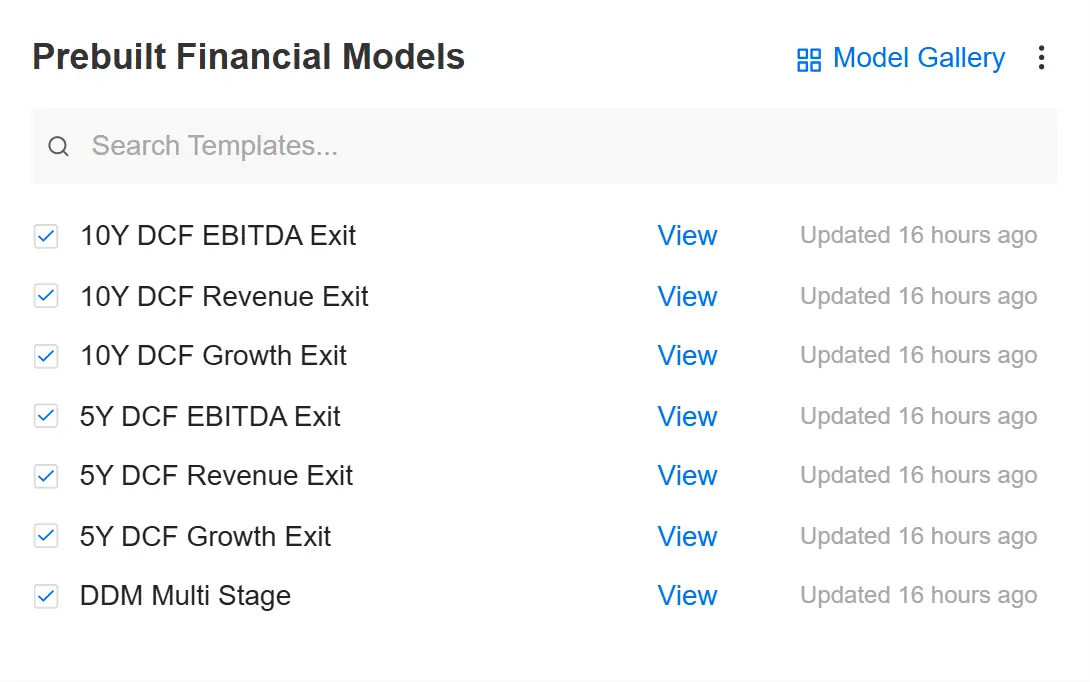
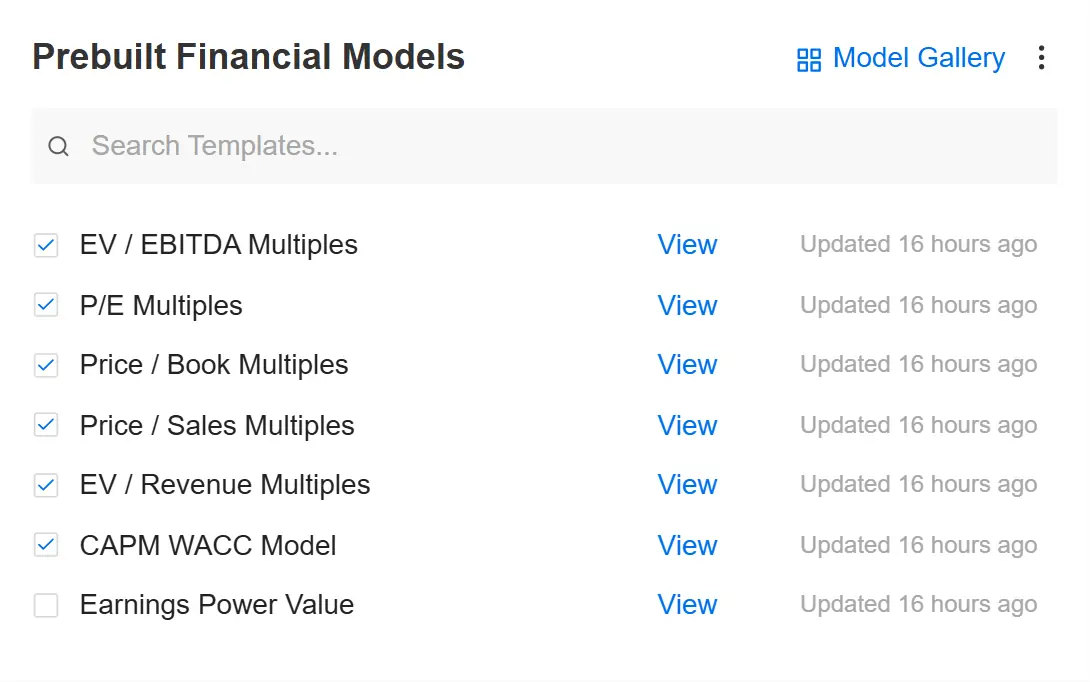
The library holds nineteen prebuilt templates, of which fourteen were active for Apple. Earnings Power Value was unchecked by default. Investing.com's own brand documentation cites seventeen models, so the figure appears to move with the stock and the data available. We counted these in the product rather than repeating a marketing number.
Financial Health · is the business any good
Apple scored 3 for cash flow, 3 for growth, 3 for price momentum, 4 for profitability, and 1 for relative value.
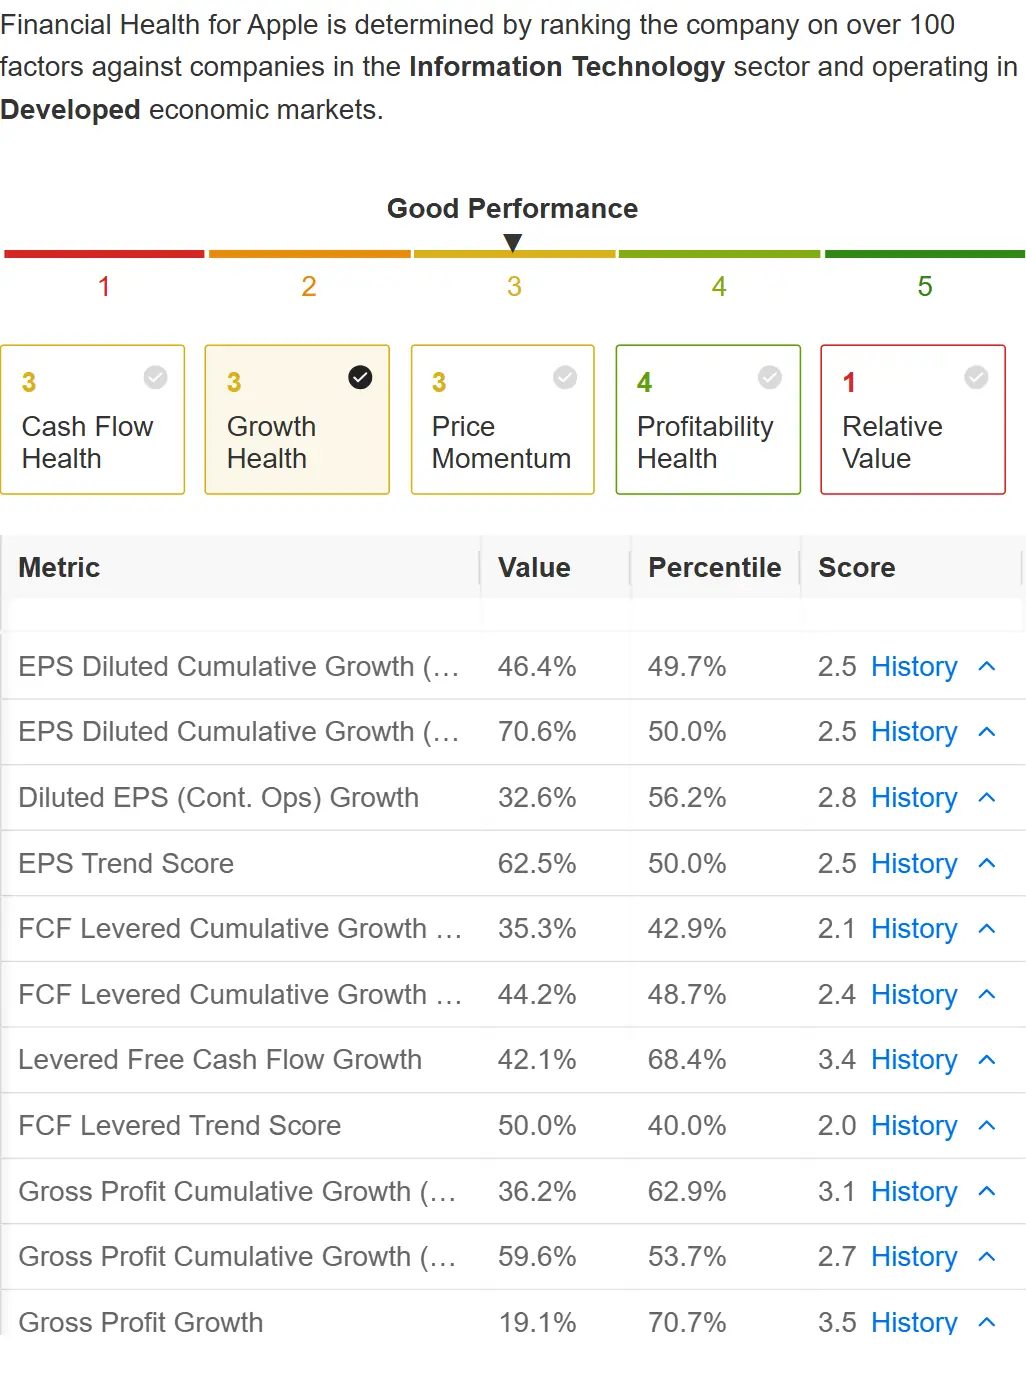
The scoring is relative, not absolute. Apple is ranked against other information technology companies in developed markets across more than a hundred factors. A 1 on relative value does not say the business is weak. It says the stock is expensive next to its peers, which is a very different claim and a much more useful one.
The detail view also exposes something the summary card smooths over: the displayed scores are rounded. The real numbers were 2.81, 3.16, 2.76, 4.43 and 1.26. Two metrics both shown as "3" are further apart than that suggests.
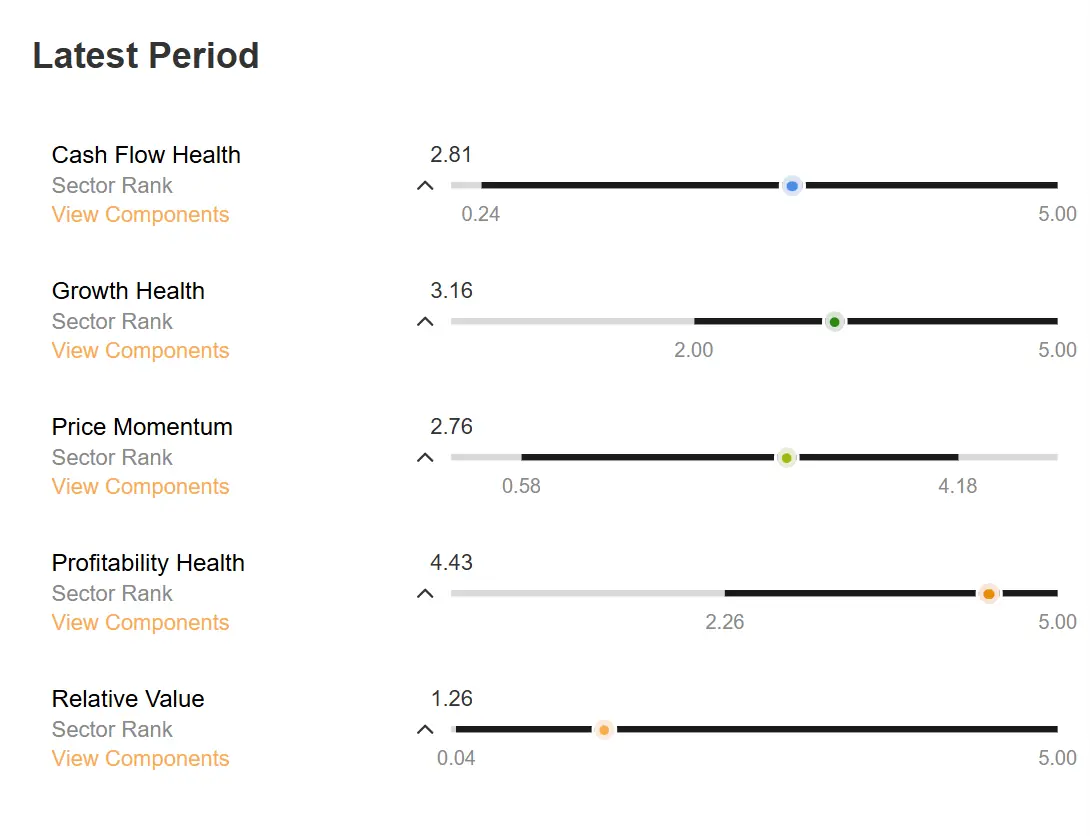
Apple scored a clean 5.0 on revenue trend, gross profit trend, operating income trend and total debt trend, and still came out at 1.26 on value. Excellent on every operational measure, expensive anyway. That single contrast was the clearest thing the tool told me all day, and it explains the Fair Value gap without needing the model detail at all.
ProTips · the fast read
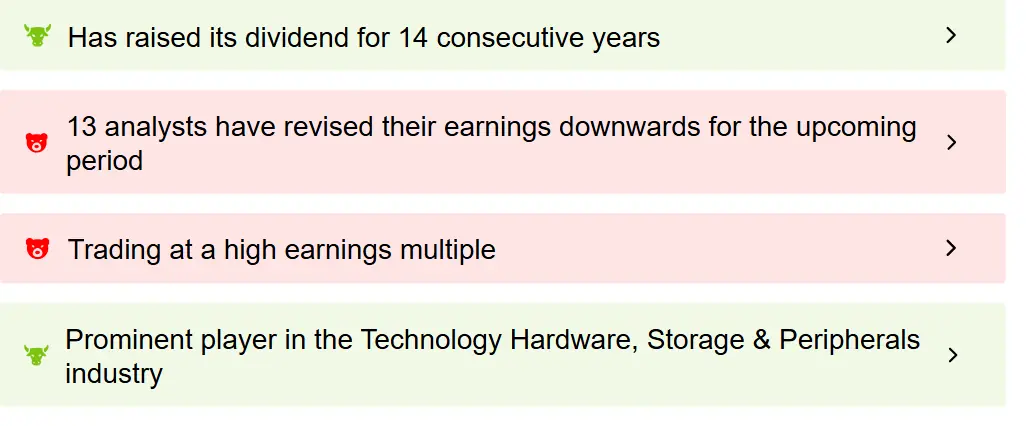
ProTips surfaces short observations, and to its credit it surfaces unflattering ones. For Apple: fourteen consecutive years of dividend increases and a strong industry position, next to thirteen analysts revising earnings down and a warning about the earnings multiple.
WarrenAI · the research assistant
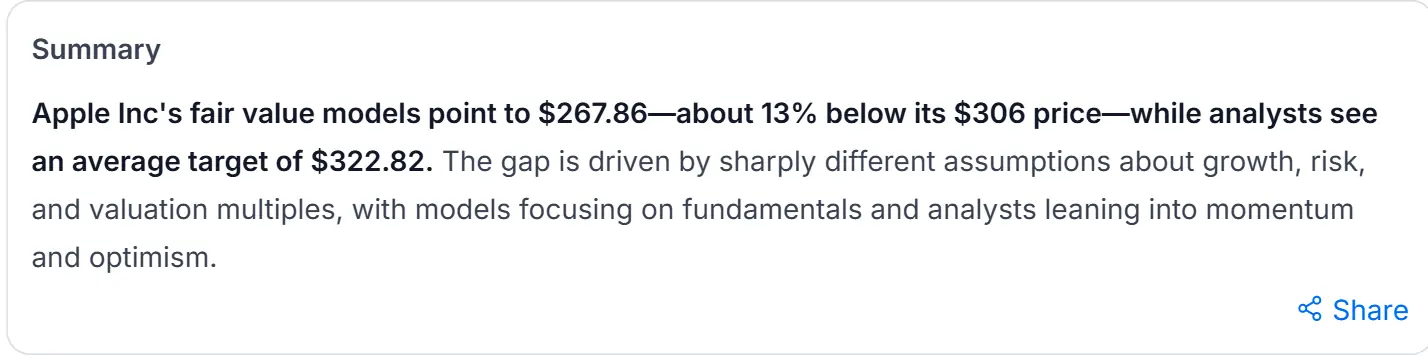
I asked it to explain the contradiction I had just found: Fair Value said $267.86 while 41 analysts averaged $322.82.
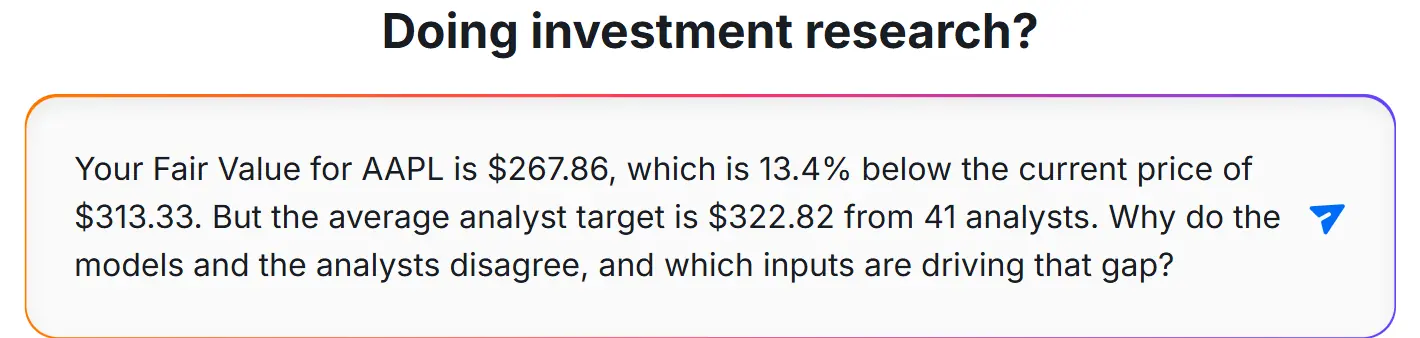
The answer was substantive rather than decorative. It identified the mechanism, that models anchor to fundamentals while analysts weight momentum and forward expectations, and backed it with specifics: revenue growth of 14.7 percent and EPS growth of 19.5 percent forecast for FY2026, EBITDA margin at 34.8 percent, WACC at 10 percent, and a trailing P/E of 38.1 against EV/EBITDA of 26.4.
It then laid the two views side by side with its own assessment in a third column.
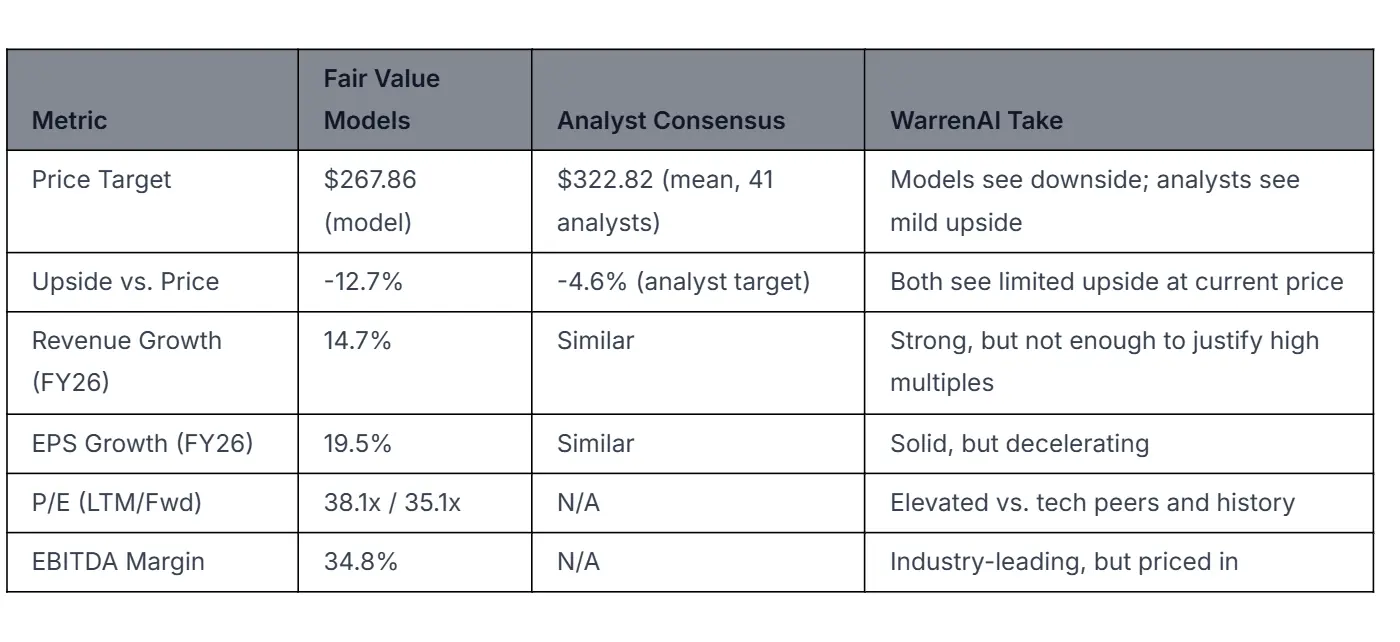
One error, reproduced on a second date, and the product contradicts itself inside a single answer. On 11 August 2026 we asked whether Apple was overvalued and what analysts thought. The summary at the top of the answer read that analysts see just a -4.6% downside to their average target. Further down, in the body of the same answer, it read that the average price target is $322.53, just 4.6% upside. Same figure, opposite sign, one response.
The body is the one that is right. The answer states the price as $308.26, and $322.53 against $308.26 is 4.63 percent above, not below. Investing.com's own sidebar on the Apple page agreed at the same moment, showing a price target of 322.28 with an upside of +4.55%. Two of the three displays are correct. The one that is wrong is the summary paragraph, which is the part most readers will read and the only part many will read.
This also matches what we saw on 10 August, when the same field appeared as -4.6% alongside commentary describing mild upside. At that point we could not tell whether the percentage was measuring something the label did not explain, so we said so rather than calling it an error. With the sidebar figure and the internal contradiction both captured on 11 August, that caution is no longer warranted. The magnitude is right and the sign is inverted.
We went back on 11 August and tested it across four companies. The pattern held on three of them and the underlying data was accurate throughout, which is set out case by case with the screenshots in our WarrenAI review. We are reporting it because a research assistant that reverses a sign in its own summary is worth knowing about before you rely on one, not because it makes the product unusable. The underlying data was correct in two places out of three, and the failure is in the layer that summarises rather than in the data itself. It is on the list for the next 90 day check, and if it is fixed we will say so with the same prominence.
This is not a reason to dismiss the tool, and it is worth saying that Investing.com tells you to check: the interface carries the line that WarrenAI may provide incorrect information and is never financial advice. We simply found a concrete example of why that line is there.
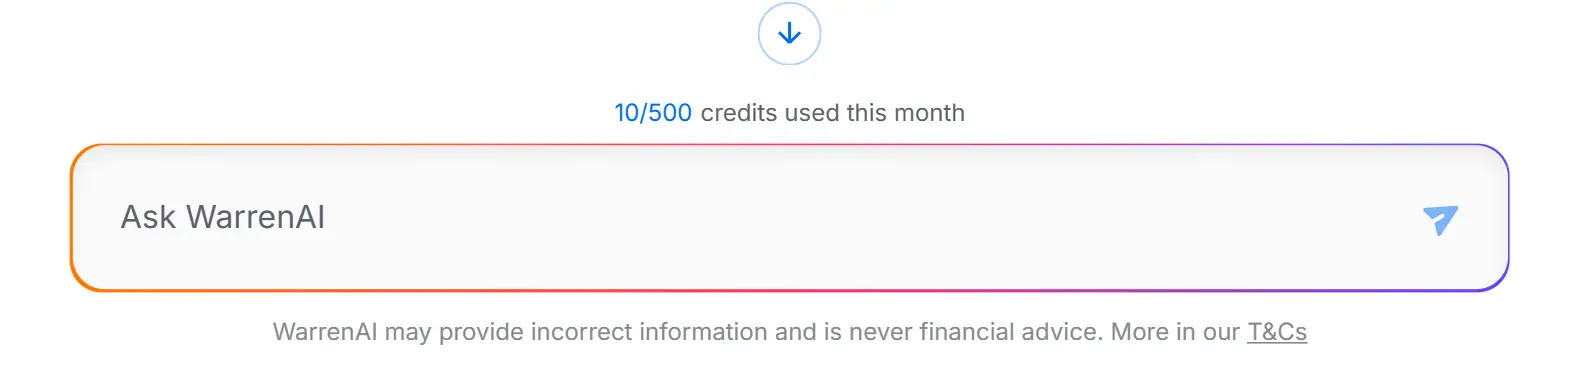
That screenshot also answers a question no other review seems to: the allowance is 500 credits a month on the tier tested.
The screener
I built a screen with an actual thesis rather than a demonstration: technology companies the models consider undervalued, but only the financially healthy ones. Four filters, market cap above a billion, Fair Value upside above 15 percent, sector information technology, overall health score above 3.
Ninety-four matches from a universe of 152,080 instruments.
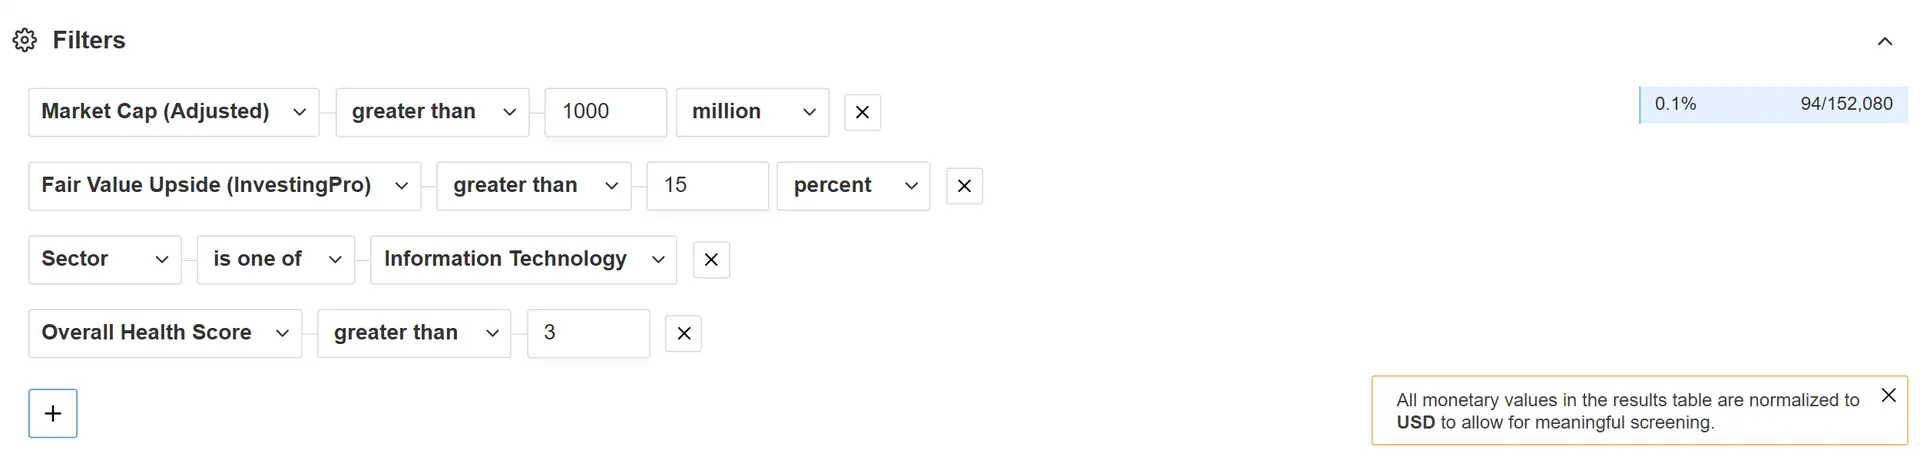
A trap worth knowing about. There are two similarly named metrics. "Fair Value (InvestingPro)" filters on the dollar figure. "Fair Value Upside (InvestingPro)" filters on the percentage gap. I picked the first by mistake and built a screen that filtered essentially nothing, because every stock has a Fair Value above zero. Check which one you have selected.
Apple, incidentally, does not survive this screen. Consistent with everything above.
The metric catalogue is organised into ten categories: growth, efficiency, financials, forecast, predictions, health, technical, ETF, finance and miscellaneous. Investing.com's marketing cites more than 1,200 filters. The interface does not display a count, so we have not reproduced that figure as fact.
Ten years of financials
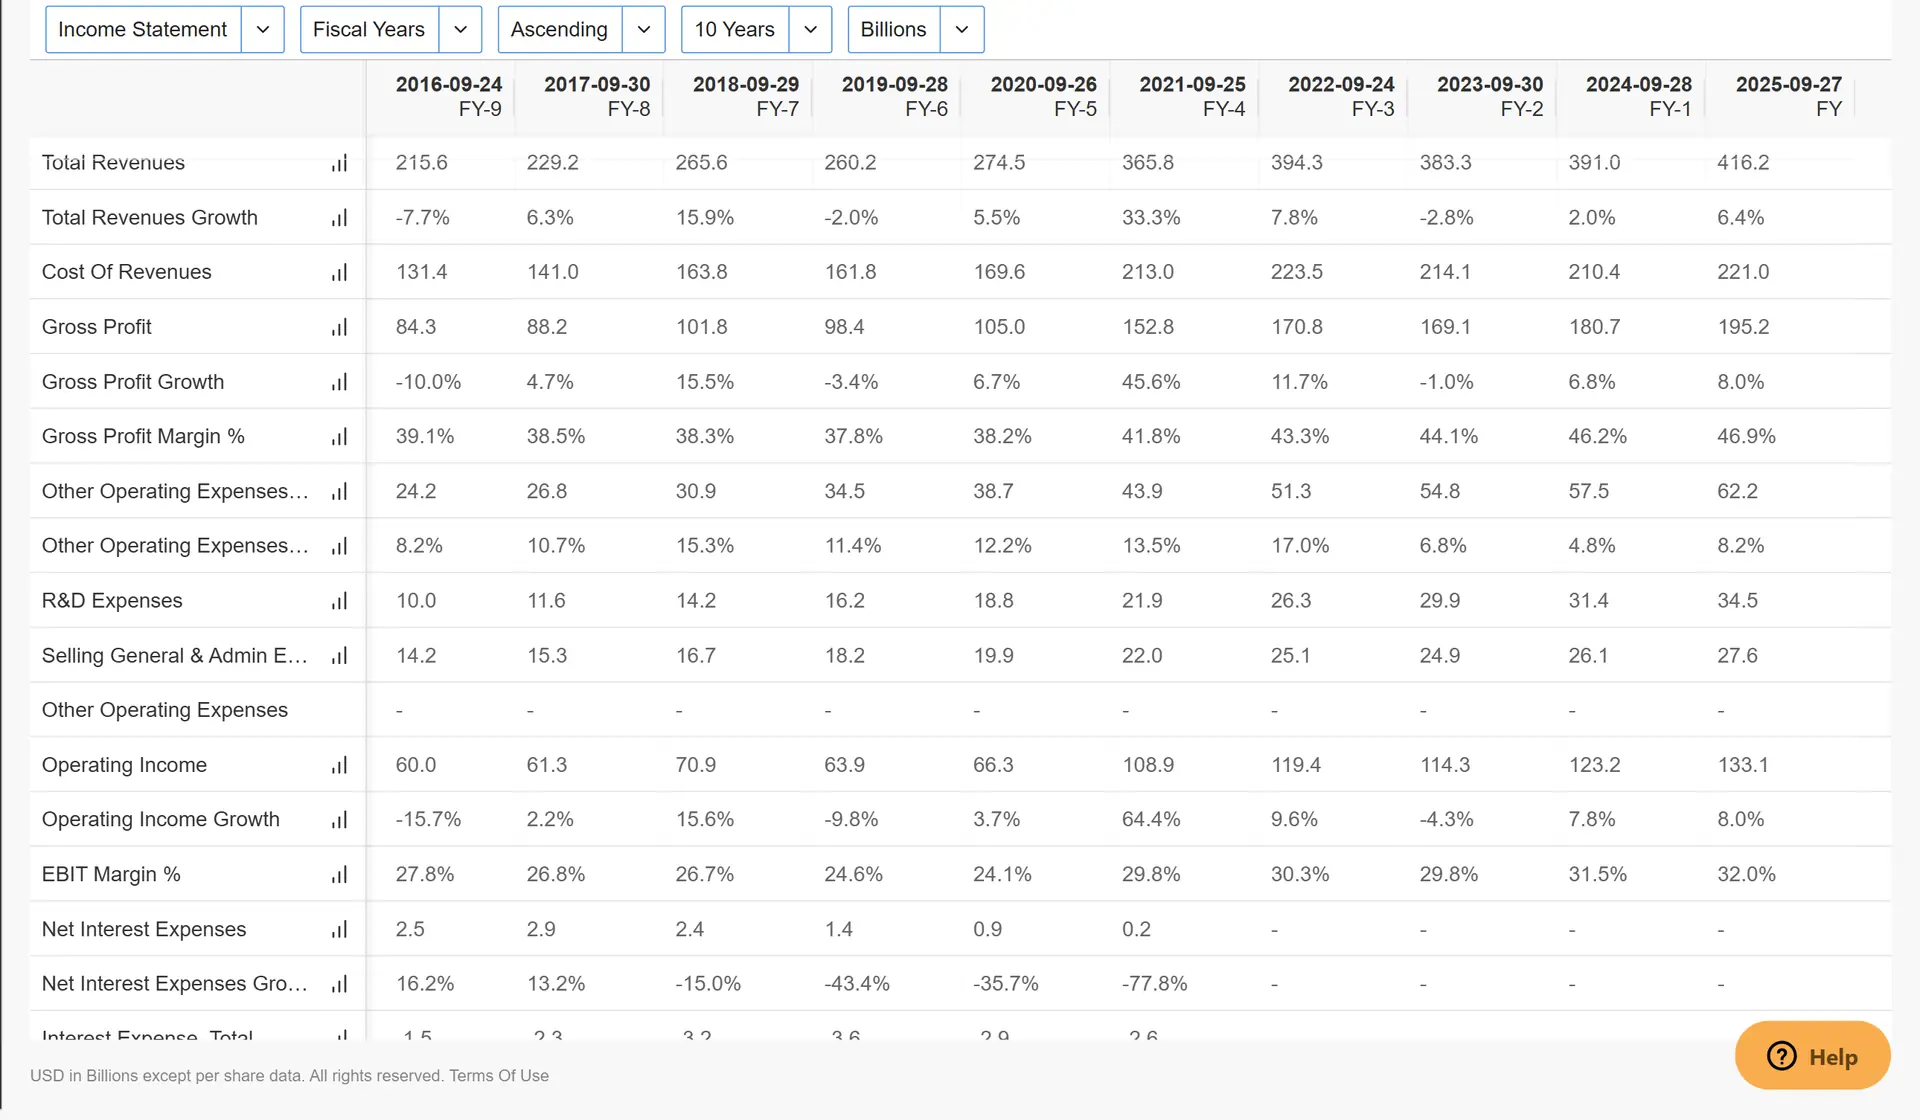
Revenue from $215.6bn in FY2016 to $416.2bn in FY2025, with gross margin climbing from 39.1 to 46.9 percent. But the growth line reads 6.3, 15.9, -2.0, 5.5, 33.3, 7.8, -2.8, 2.0 and 6.4 percent. Lumpy, and decelerating since the 2021 spike. Ten years is the ceiling, including on Pro+.
ProPicks AI and how to read the performance figures
This is where most reviews of this product go wrong, so it is worth going slowly.
ProPicks AI is a set of AI-built stock strategies, rebalanced monthly or quarterly. Investing.com publishes 88 of them across global markets. Filter to the United States and you get ten.
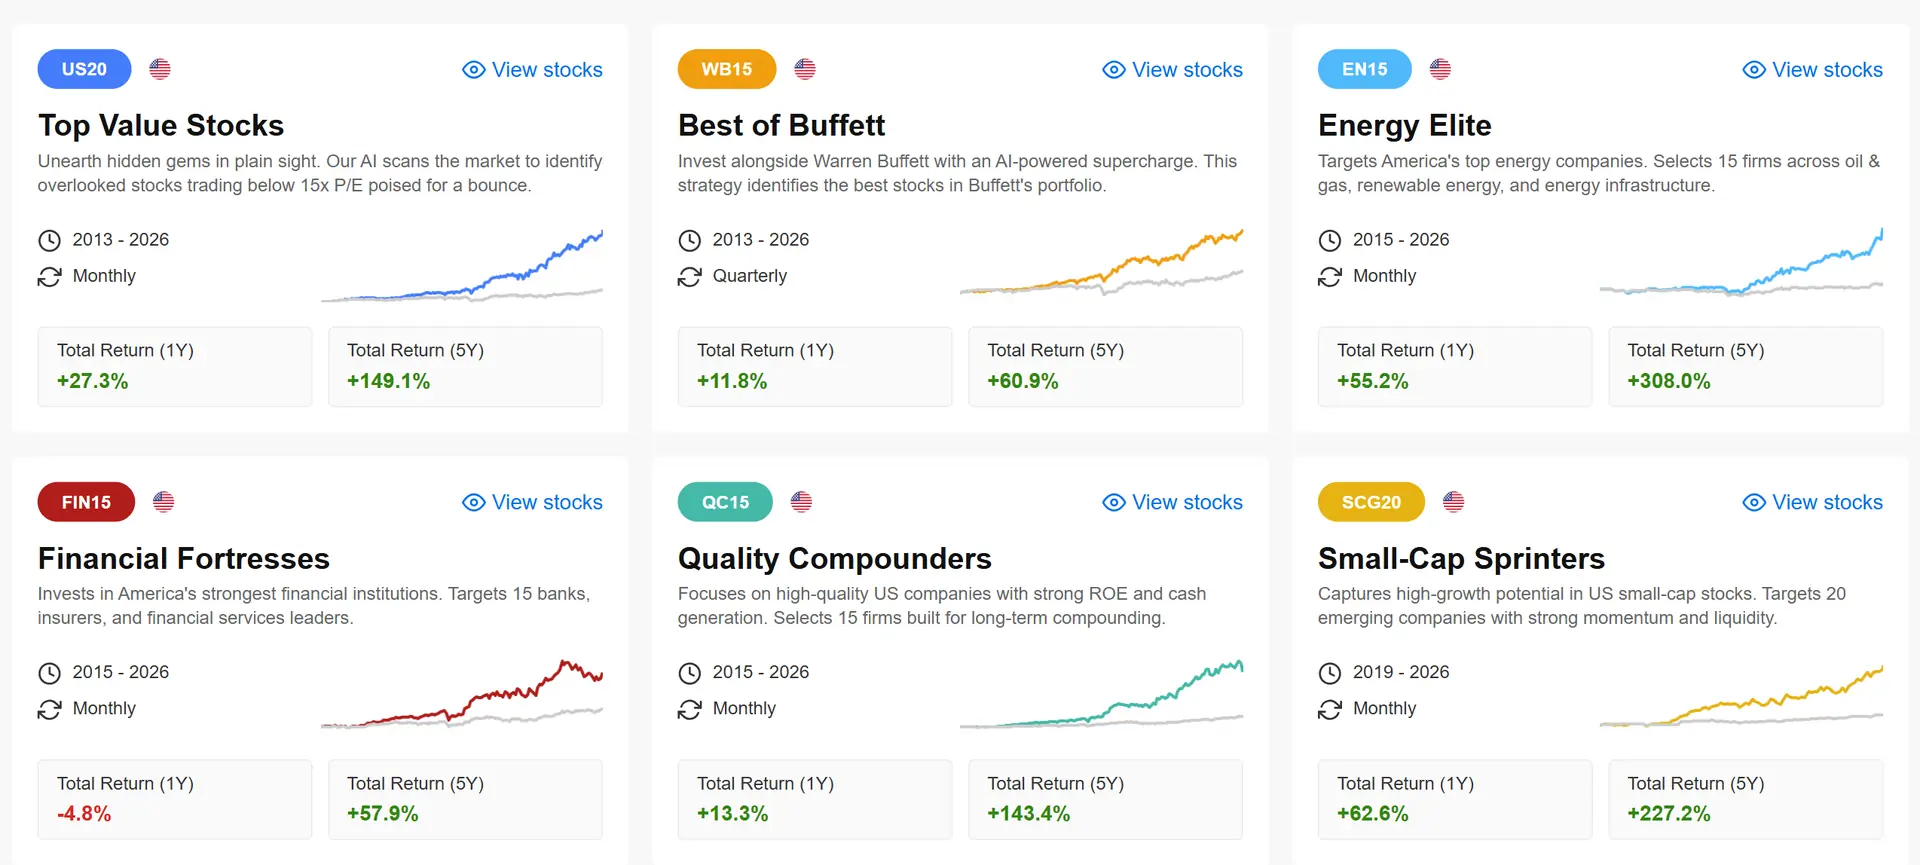
That ratio matters more than it first appears. If you invest only in US equities, roughly a ninth of the catalogue is relevant to you. If you invest internationally, the reverse is true, and this is precisely where InvestingPro separates itself from the US-centric alternatives.
Backtested and live are different numbers
The Tech Titans strategy displays a total return of +3,387.1 percent, outperformance of +2,943.2 percent, and an annualised return of +29.9 percent.
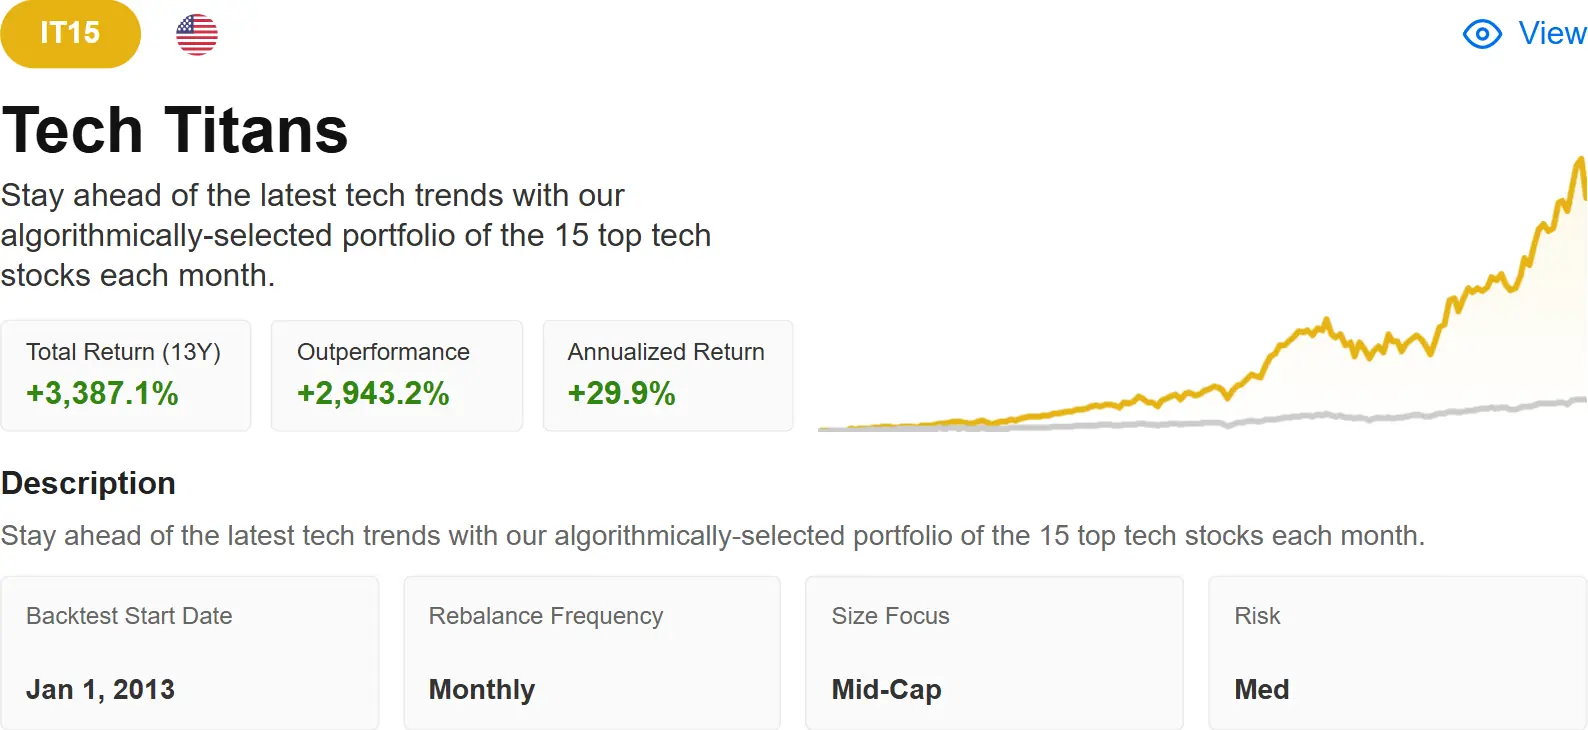
ProPicks AI has been running live since November 2023. Figures reaching back to 2013 are backtested, and Investing.com labels that field itself rather than burying it. The strategy page describes "this historical backtest" and says the selections show how they "would have performed". The chart is annotated as simulated and carries the line that past returns do not guarantee future results.
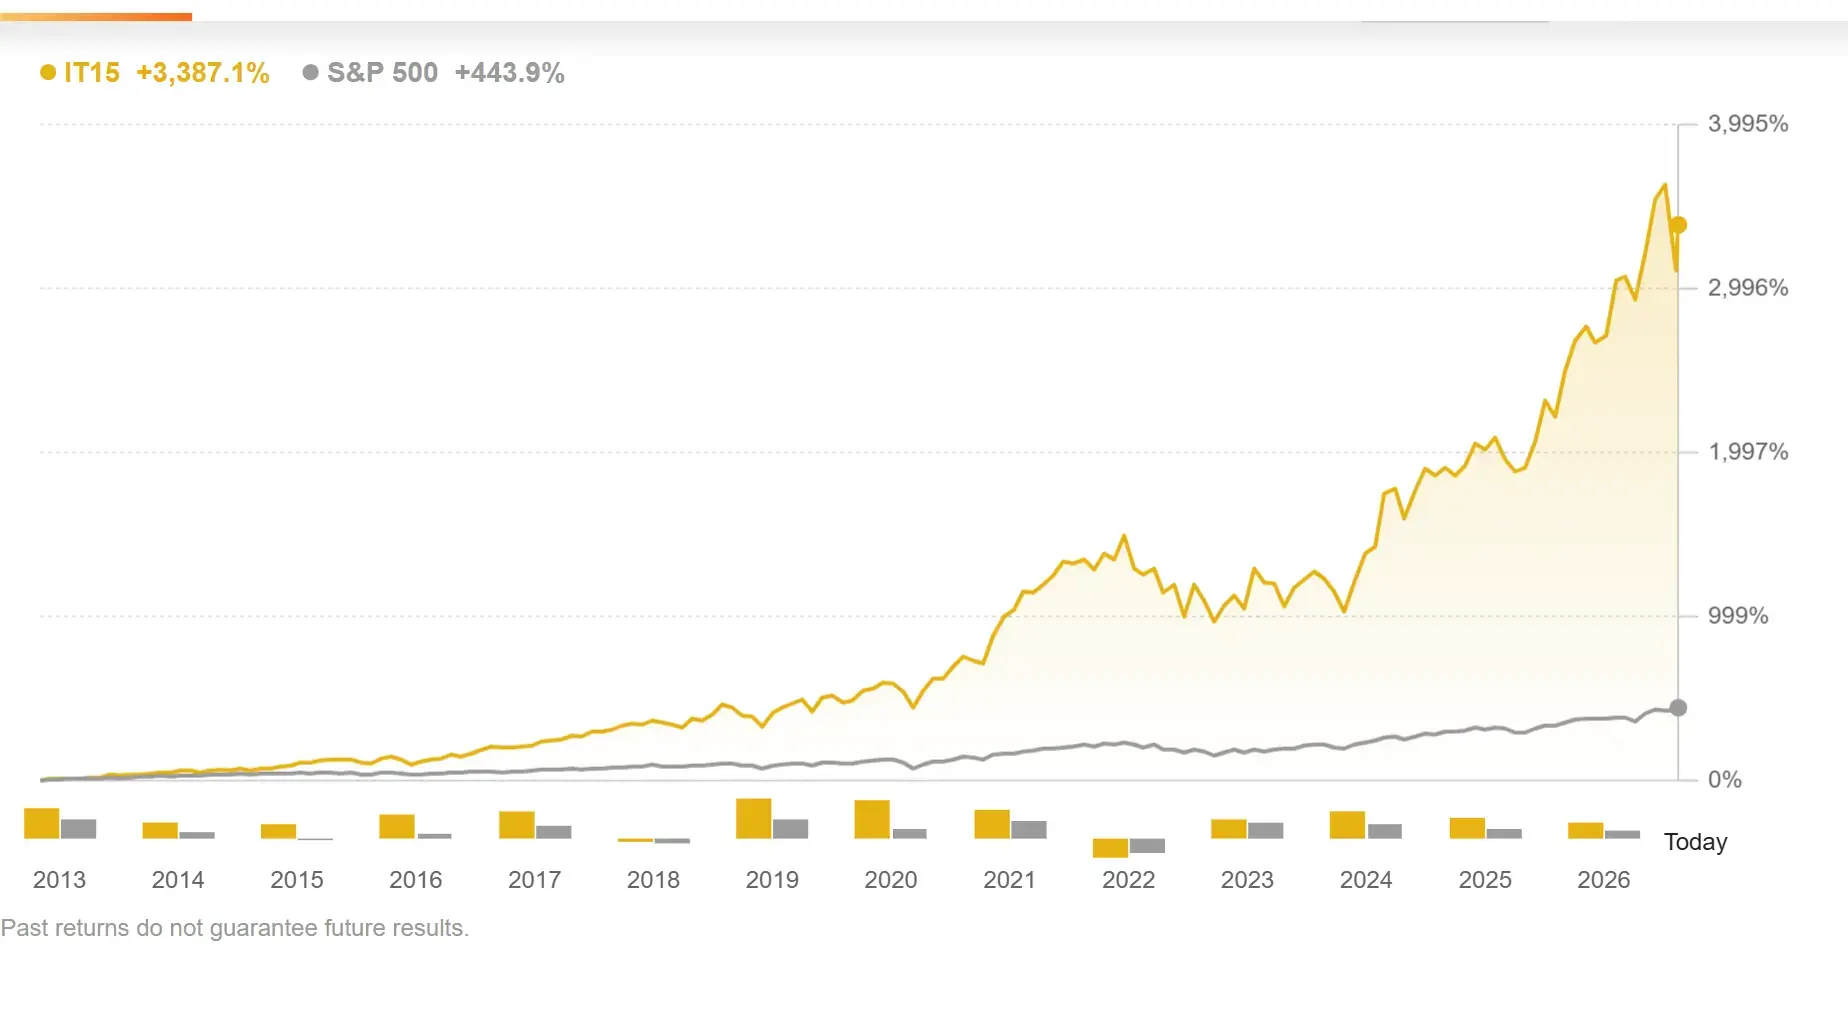
The methodology page is more explicit again. Describing the flagship Beat the S&P 500 strategy, which shows +1,229.0 percent against +443.9 percent for the index, Investing.com writes that the chart illustrates the hypothetical historical performance of the strategy.
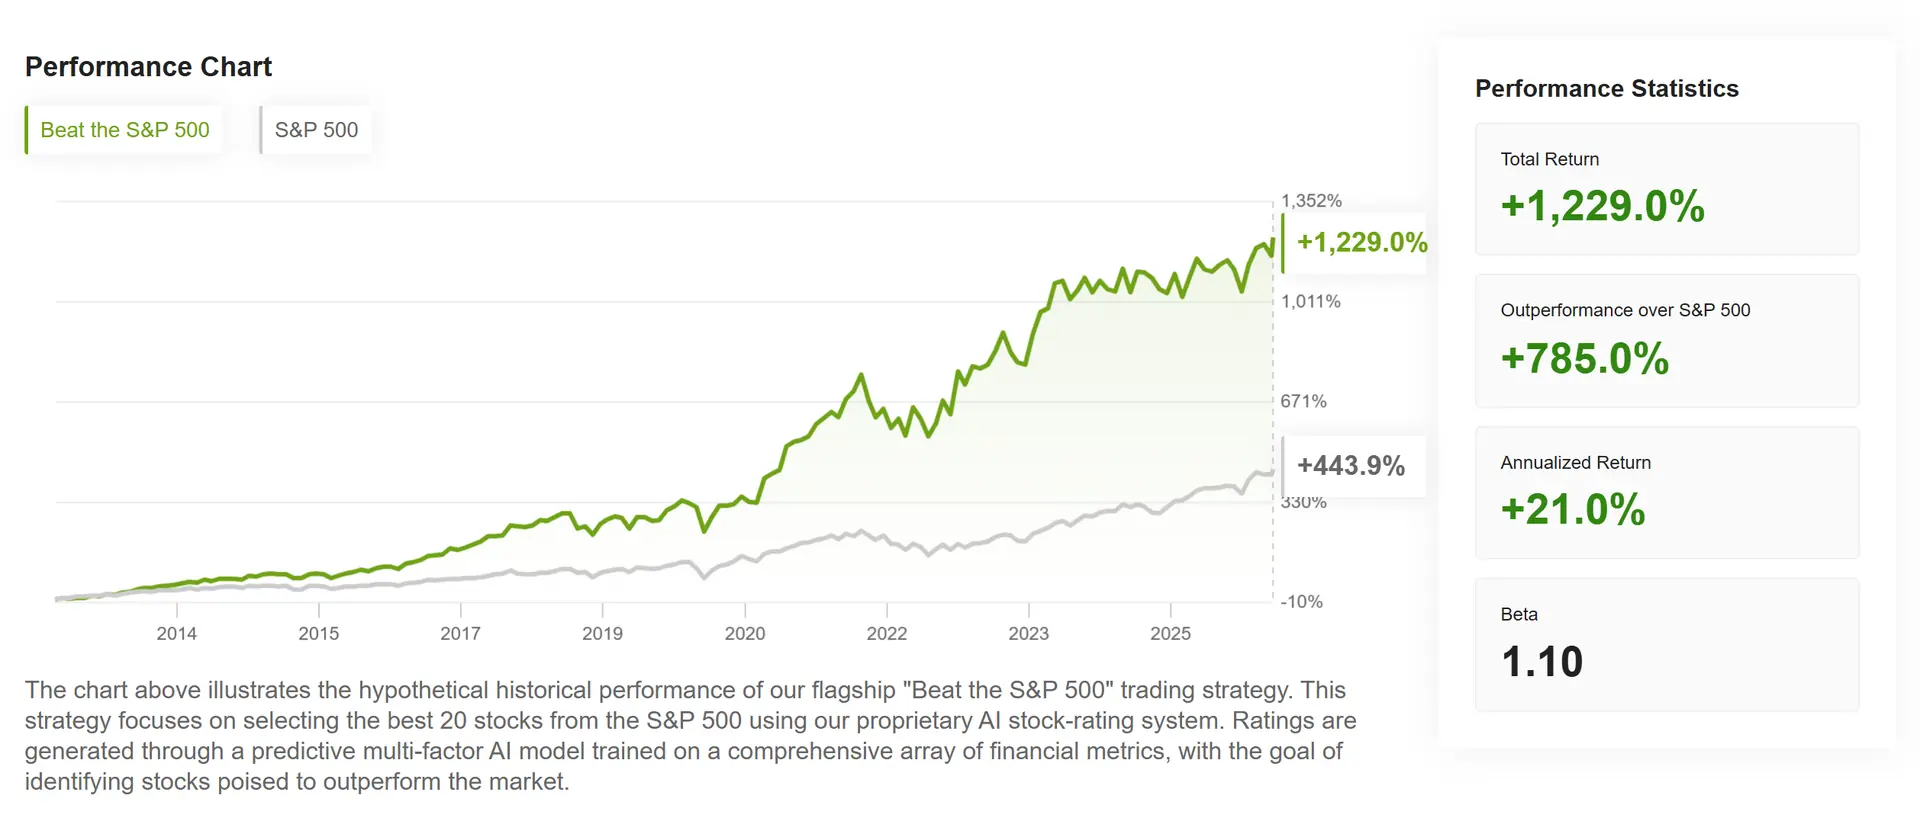
So what has that same strategy returned as a live product? Its card lists +17.8 percent over one year and +83.7 percent over five.
Both numbers are accurate. They measure different things. A reader who sees 1,229 percent and expects that rate of return has misread what is on the screen, and Investing.com is not the party responsible for that. The company publishes the distinction clearly. Most of the reviews written about it do not.
The bias disclosures
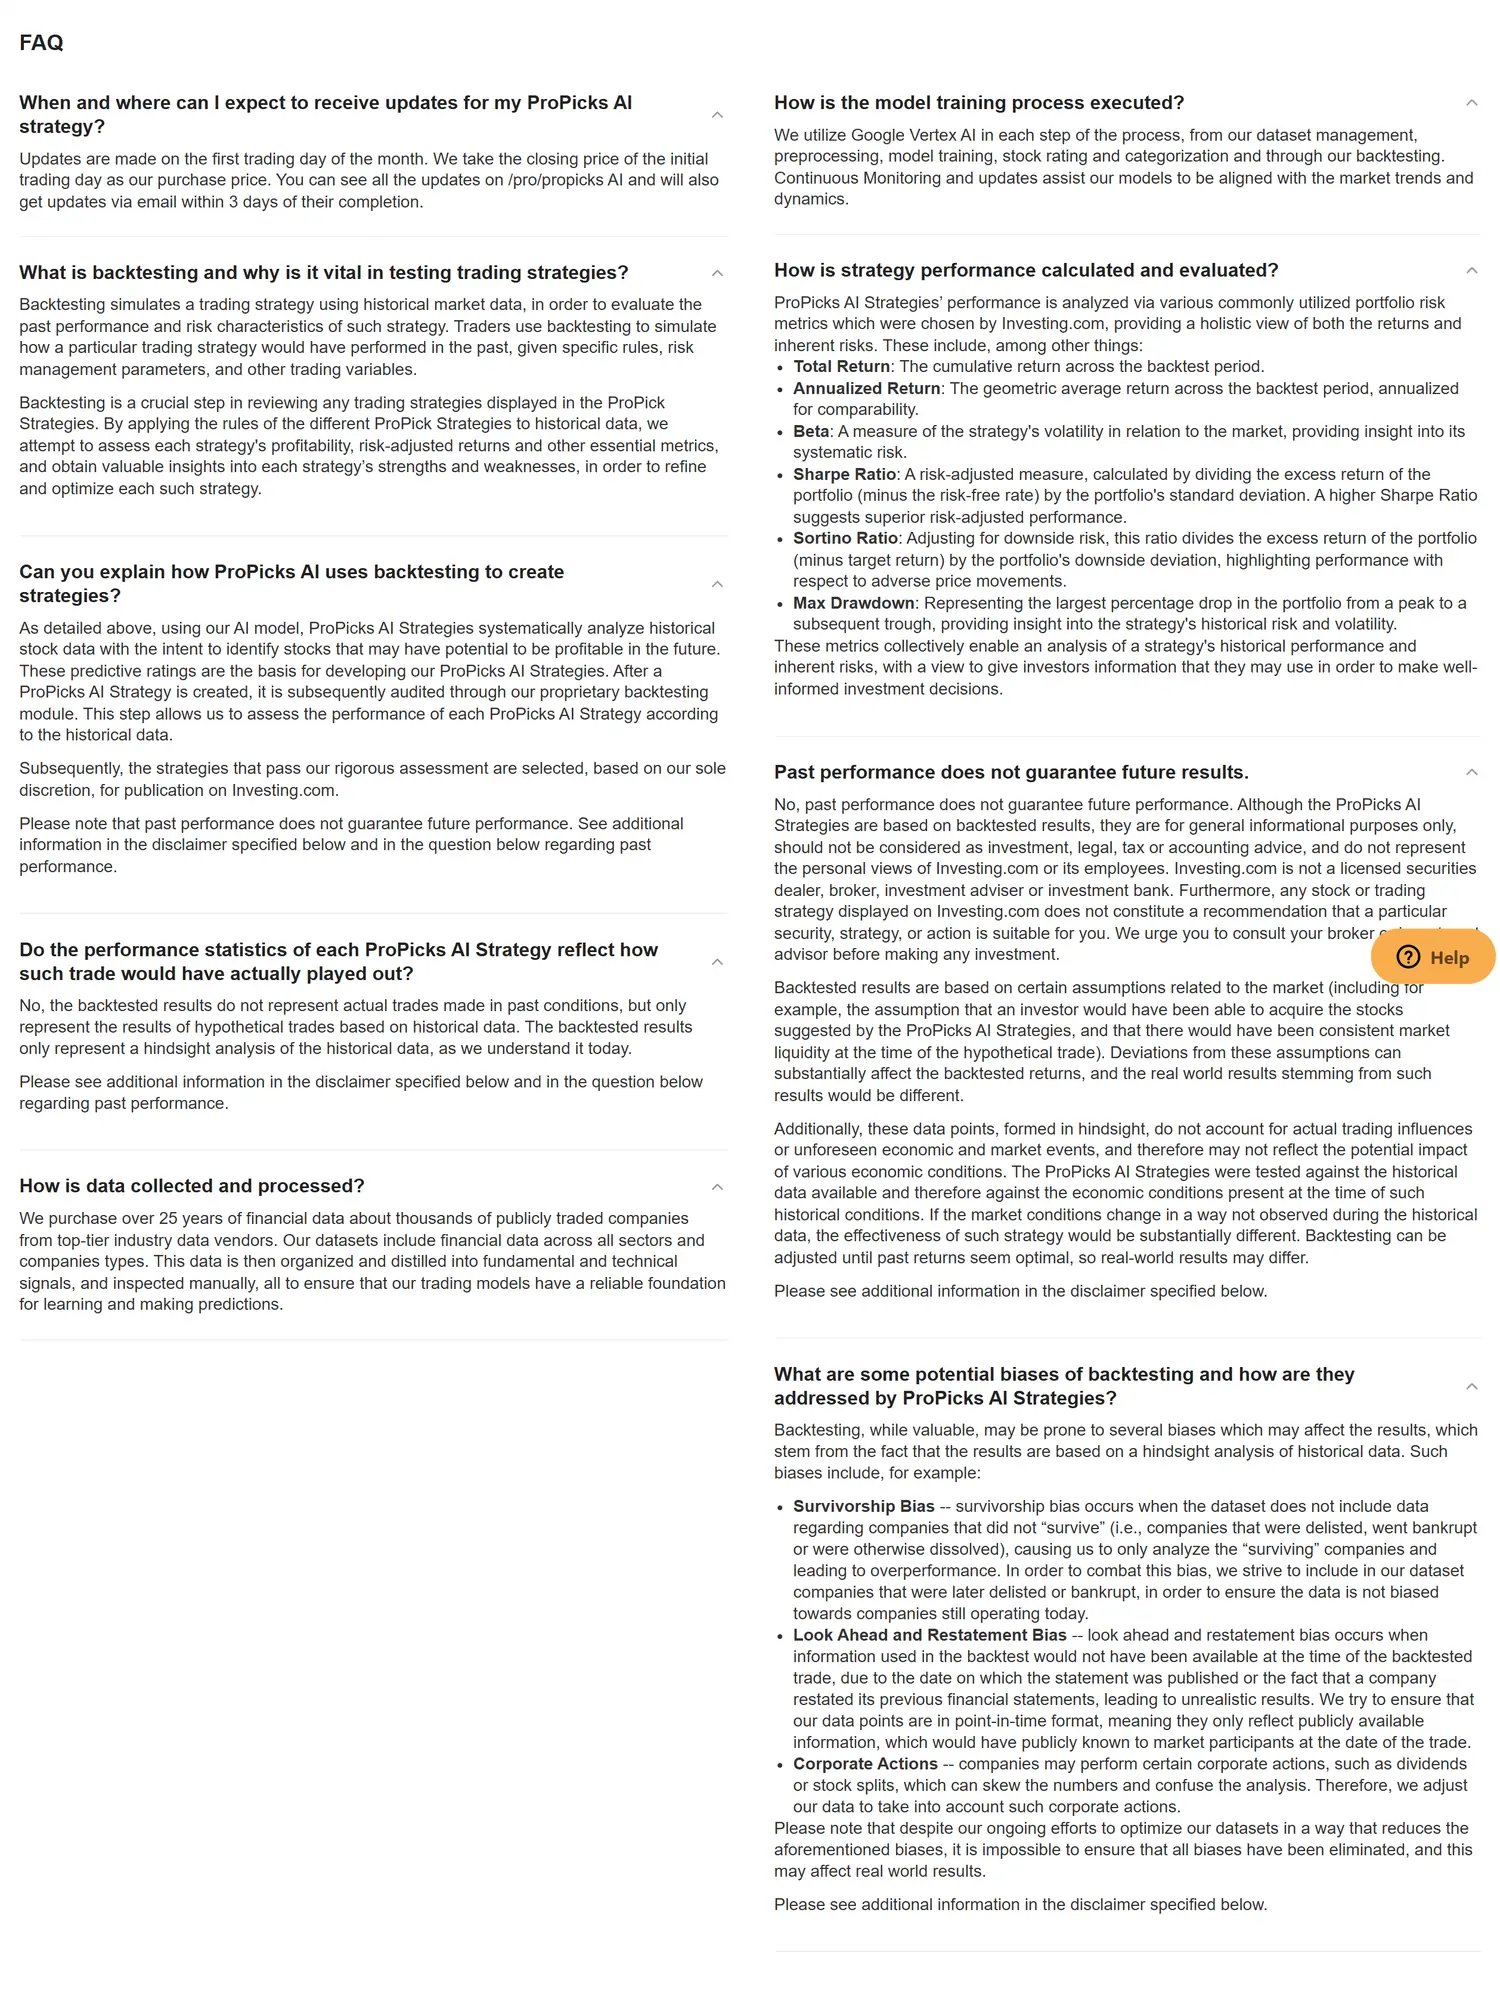
The methodology FAQ addresses backtesting bias directly, naming survivorship bias, look-ahead and restatement bias, and corporate actions, and describing how each is mitigated. It closes by saying it is impossible to guarantee all biases have been eliminated. It also contains this sentence, which is a candid thing for any vendor to publish about its own headline numbers: backtesting can be adjusted until past returns seem optimal, so real-world results may differ.
Picks are tracked both ways
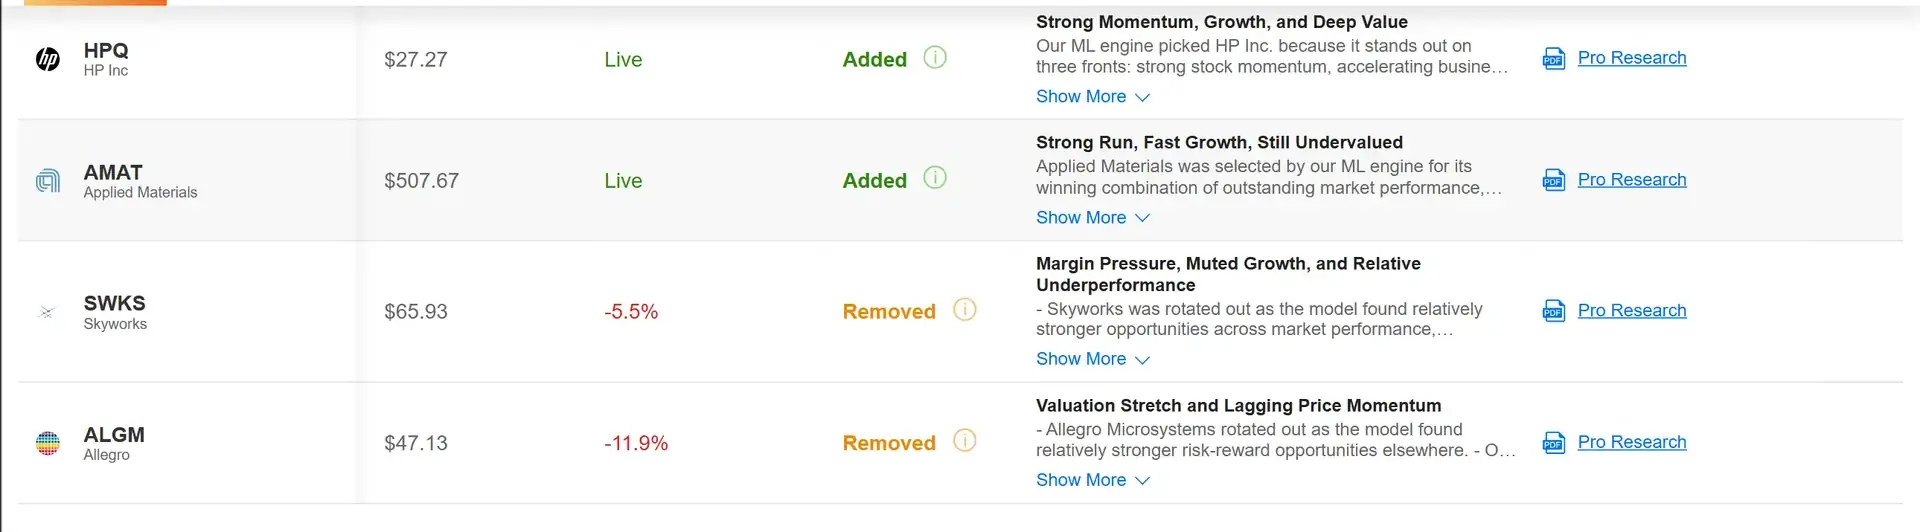
The picks history shows additions and removals with performance attached. In the August 2026 rebalance, HP and Applied Materials went in; Skyworks came out at -5.5 percent and Allegro at -11.9 percent.
Strategy performance is not uniformly positive either. Across the ten US strategies, one-year returns ran from Financial Fortresses at -4.8 percent to Small-Cap Sprinters at +62.6 percent, a spread we set out strategy by strategy in our ProPicks AI review. Which strategy you follow matters considerably more than whether you subscribe. The flagship also carries a beta of 1.10, meaning more volatility than the market, not less.
Paid link. The backtest and the live figure are both on this page for a reason · 10 Aug 2026
What is missing or weak
- The Pro to Pro+ upgrade wall. Subscribers report frequent upgrade prompts when clicking features on the Pro tier. Worth understanding the split before you buy rather than after.
- Delayed quotes. Reasonable for a valuation tool, frustrating if you expected a trading terminal.
- Ten-year history ceiling, even on Pro+.
- A real learning curve. The interface assumes fluency in valuation vocabulary.
- WarrenAI reversed the sign on analyst upside in its own summary, reproduced on two dates, as shown above.
- US coverage is a minority of the strategy catalogue, which cuts both ways depending on where you invest.
What it costs
We are not going to print a headline number, and the reason is worth thirty seconds of your time.
Investing.com sells two tiers, Pro and Pro+, across monthly and longer billing terms, and it prices by country and currency. We loaded the pricing page as a logged-out visitor on 10 August 2026 and there is no price in it: the plan panel loads afterwards and fills itself in based on where you are. A sale was running, branded as the August sale, with a countdown. So the figure a reader in Tel Aviv sees is not the figure a reader in Frankfurt sees, and neither is the figure that was true last month.
That is also why the numbers circulating for this product are so inconsistent. Searching for the price on the day we wrote this returned annual figures ranging from roughly ninety dollars to roughly two hundred and ninety, each from a review site applying its own coupon code, and each presented as the price. They cannot all be right and it is not a useful exercise to pick one.
The only price that counts is on your own checkout screen. Three things to look at before you enter a card, in this order:
1 · The renewal line. Usually set in small type under the total. It is the number you will actually pay in year two, and it is the one figure nobody quotes.
2 · The billing term. A two year plan advertises the lowest monthly figure and commits you longest. Given that the subscription is non-refundable, the longest term is the last one to choose, not the first.
3 · Tax. Local tax or VAT is added on top in most countries and is not in the advertised figure.
The cost that matters is the one relative to your portfolio
A research subscription is a fixed annual cost sitting on a variable portfolio, which means it behaves exactly like a fund expense ratio and gets cheaper, proportionally, the more you have invested. That framing is more useful than the headline price, because it answers the real question: is this cost material against what I already pay to invest at all.
The table below is arithmetic, not a price list. Take whatever your checkout says and read across.
| Portfolio | $100 a year costs | $150 a year costs | $250 a year costs |
|---|---|---|---|
| $10,000 | 100 bps | 150 bps | 250 bps |
| $25,000 | 40 bps | 60 bps | 100 bps |
| $50,000 | 20 bps | 30 bps | 50 bps |
| $100,000 | 10 bps | 15 bps | 25 bps |
| $250,000 | 4 bps | 6 bps | 10 bps |
For context, a mainstream index fund charges somewhere between 3 and 20 basis points a year, and our expense ratio calculator will tell you what your own funds come to once they are weighted together. On a $10,000 portfolio, a research subscription of any price on this table costs several times more than the fund fees you are presumably trying to keep low, which is a strange position to be in. On $100,000 it is a rounding error against a single quarter's move. Somewhere between those two rows the subscription stops being an expense and starts being a tool, and where that line falls is a question about your portfolio rather than about the product.
What separates Pro from Pro+
Investing.com's own pricing page draws the line at data depth rather than at features you can see. It advertises access to more than 1,200 stock data metrics and ten years of history across more than 72,000 stocks, while describing the screener as filtering through 167 metrics. Those two numbers get conflated constantly in reviews of this product, including by people quoting the larger one as the screener's filter count. They measure different things.
In our session the ten year ceiling held on the higher tier as well, so paying up does not buy a longer record. The practical test is narrower than the marketing suggests: if you screen heavily, export data, or want the deeper metric set, the upper tier is what you are buying. If you mainly open Fair Value, ProTips and the health score on companies you already follow, the entry tier covers it.
Paid link. The rating is 4.1, not 5, and it was set before the arrangement · 10 Aug 2026
Before you buy: renewal, cancellation and refunds
This is the section almost no review of this product bothers to write, which is odd, because it is the part that decides whether a subscription becomes a complaint. Everything below was read on 10 August 2026 from Investing.com's own terms and its own support pages, not from other reviews.
The subscription renews by itself
Like almost every subscription of this kind, it renews automatically at the end of the billing term. The terms allow you to cancel the automatic renewal at any time up to 24 hours before the billing date. The practical implication of a heavily discounted first term is the one worth sitting with: the discount applies to the term you bought, and the renewal is charged at the standard rate in force at that time, not at the price you first paid. Diarise the renewal date on the day you subscribe, not eleven months later.
How to cancel, exactly
Investing.com's support article sets out the path: open the InvestingPro homepage, select the username icon in the top right, choose Plan Summary, then Cancel Subscription. Two details in that article matter more than the steps. First, deactivating or deleting your Investing.com account does not cancel the subscription, which is a trap people fall into and then dispute the charge. Second, if you subscribed through the Apple or Google app stores, the billing is held there and the cancellation has to happen there too.
Refunds: read this before you subscribe, not after
What Investing.com states. Its support article on cancellation and refunds, updated 9 August 2026, says InvestingPro services are provided on a non-refundable basis. You can cancel at any time, the subscription then does not renew after the current billing period, and paid access remains active until that period ends. The terms and conditions state the same thing in capitals, and add that by subscribing you receive immediate access and waive any right of withdrawal.
What circulates elsewhere. A number of affiliate pages describe a 7 day money-back guarantee on annual plans. We could not find that wording in the official terms or in the official support article on 10 August 2026.
What we are publishing. The non-refundable statement, because it is the one on the company's own pages. If a 7 day guarantee is offered to you at checkout, it will say so on the checkout screen. Screenshot that screen before you pay. We will update this section, dated, the moment either document changes.
None of this makes the product unusual. Most research subscriptions are sold on the same basis and most reviews of them simply never mention it. It does mean the decision is a real one: you are buying a term, not a trial, so treat the first month as the evaluation you already paid for and use it properly.
Paid link. The price is set by country, which is why we publish none · 10 Aug 2026
How it compares
Four tools come up whenever this one does. We hold no commercial relationship with any of the four, and the prices below were read from each company's own pages on 10 August 2026 rather than from other review sites, which contradict each other badly on every one of them. If you are weighing this against the field rather than deciding on it alone, our six InvestingPro alternatives compared goes deeper, adds TIKR and Stock Analysis, and publishes the ranking weights before the ranking.
| Tool | Published price | Read from |
|---|---|---|
| InvestingPro | Not published to logged-out visitors · priced by country | Investing.com pricing page |
| Seeking Alpha Premium | $299 a year | Seeking Alpha subscription page |
| Simply Wall St | Not published to logged-out visitors | Simply Wall St plans page |
| Koyfin Plus | $39 a month, billed annually | Koyfin pricing guide, updated 27 Jul 2026 |
| Morningstar Investor | $249 a year or $34.95 a month | Morningstar Investor page |
Seeking Alpha
The closest competitor on depth of written research, and the one most readers are actually choosing between. Seeking Alpha's own subscription page lists Premium at $299 a year and the Alpha Picks service at $499, with the two together carrying a list price of $798 discounted to $718 for a first year, after which each renews at the annual list price then in force. That renewal wording is unusually plain and worth reading before you subscribe to anything. The strength is volume and variety of long-form analysis on US companies, plus quantitative scoring across that universe. The limits are that it is heavily US weighted and that Premium is sold annually with no monthly option. On the axis that matters here, InvestingPro is the global and lower priced way to buy roughly the same job, and ProPicks AI is the nearest equivalent to Alpha Picks, with the same caution about reading the live figures rather than the backtests.
Simply Wall St
The visual option, and the friendliest of the four to a newer investor. Its own plans page sets out three tiers: a free plan with five company reports a month, one portfolio holding up to ten positions and limited screeners; Premium at thirty reports a month, three portfolios of up to thirty holdings, three saved screeners and brokerage linking; and Unlimited with unlimited reports, five portfolios, unlimited holdings, ten screeners and export to Excel and PDF. Financial data comes from S&P Global Market Intelligence. Notably, no price appears on that page to a logged-out visitor, so we are not publishing a figure we could not read at source. The company's terms also state that a discounted rate applies only for the discounted period before reverting to standard pricing. The axis is data depth against visual simplicity: Simply Wall St tells you the conclusion quickly, InvestingPro shows you fourteen models and makes you choose.
Koyfin
The closest thing to a terminal at a consumer price, and the pick for anyone who wants charting, dashboards, estimates and custom formulas rather than a verdict. Koyfin's own pricing guide, updated 27 July 2026, lists Free at nothing, Plus at $39 a month and Premium at $79 a month, both billed annually, which works out at $468 and $948 across a year. Koyfin also retired the Pro plan and is moving existing Pro subscribers onto Premium at the price they already pay, which is a rare example of a repricing that does not raise anyone's bill. There is a thirty day satisfaction guarantee. What Koyfin does not do is hand you a valuation output: there is no Fair Value panel, no composite health score and no research assistant, because the design assumes you build the analysis yourself. Consumer packaging against terminal breadth, and most investors want the packaging.
Morningstar Investor
The analyst-led option, and the only one of the four whose ratings carry weight with financial advisers. Morningstar's own page lists Investor at $249 a year or $34.95 a month, with a free trial and, per its help centre, no free tier at all once the trial ends. What you are buying is independent analyst judgement: fair value estimates and economic moat ratings written by people, supported by four decades of fund and ETF data that nothing else on this list matches. What you are not buying is a model panel, a screener over 152,080 instruments or an AI assistant. The split is clean. If your portfolio is mostly funds and ETFs, Morningstar is the better tool and it is not a close call. If you analyse individual companies and want the valuation arithmetic laid out rather than summarised, that is what InvestingPro is built to do.
The verdict
InvestingPro is a research tool that happens to sell a picks service, not a picks service dressed up as research. That distinction decides whether it is worth your money. Over one session we watched it produce fourteen independent valuations of the same company, score that company against more than a hundred factors relative to its sector, surface the unflattering observations alongside the flattering ones, and hand back a decade of financials without a spreadsheet. It also inverted the sign on analyst upside inside its own summary, on two separate dates, which we have documented above rather than left out.
Four point one out of five. The score is held back by a learning curve that assumes you already speak valuation, by delayed quotes, by a ten year history ceiling that Pro+ does not lift, and by a US strategy catalogue that is a minority of the whole. It is carried by data depth that is genuinely unusual at a consumer price and by a level of self-disclosure on performance that most of the sites reviewing this product do not bother to repeat.
Buy it if you research individual companies and will open it weekly. Skip it if you hold index funds, if you need live prices, or if the honest answer is that you will use it twice. If you are in that second group, a free tracker covers you: our guides to Google Finance portfolios and to where broker costs actually hide will do more for your returns than any subscription on this page. The subscription is a fixed cost against a variable portfolio, which means it behaves like an expense ratio: trivial on a large portfolio, expensive in basis points on a small one.
Paid link. No price before checkout, no refund after. Now you know · 10 Aug 2026
Common questions
Is InvestingPro a scam?
No. InvestingPro is the premium subscription of Investing.com, a financial markets platform operating since 2007. The question is common in search because the product is marketed with a near permanent sale, which reads to a lot of people as a warning sign. What we found in a logged-in session on 10 August 2026 was a working research platform with substantial proprietary data, and disclosures about its own performance figures that are clearer than most of the sites writing about it.
What is the difference between Pro and Pro+?
Pro covers the core valuation, health and screening tools. Pro+ widens access to the heavier data views and to features that Pro shows as previews. One thing Pro+ does not buy you is a longer record: ten years of financial history was the ceiling on both tiers when we checked. Subscribers report frequent upgrade prompts on the Pro tier, so the split is worth understanding before you subscribe rather than after.
Are the ProPicks returns real or backtested?
Both figures exist and they are very different numbers. For the flagship Beat the S&P 500 strategy, Investing.com publishes a backtested total return of 1,229.0 percent against 443.9 percent for the index, with a backtest start date of 1 January 2013. It also publishes live returns for the same strategy of 17.8 percent over one year and 83.7 percent over five years. Investing.com itself describes the backtested figures as hypothetical on its methodology page. Both observed 10 August 2026.
Does InvestingPro give real-time prices?
Quotes are delayed rather than live on the tiers we tested. That is reasonable for a valuation tool, where the inputs are quarterly filings and analyst estimates rather than the tick, and nothing in the research workflow we ran depends on the current second. It is a genuine problem if you expected a trading terminal.
Is this the same InvestingPro that is rated poorly on software review sites?
No. A separate and unrelated portfolio management product also uses the name InvestingPro, and it is the one listed on several software directories with low ratings. This review covers only the premium subscription of Investing.com.
How many valuation models does Fair Value use?
For Apple on 10 August 2026 the panel showed fourteen active models drawn from a library of nineteen templates, producing outputs from $204.85 to $293.22 and an average of $267.86. Earnings Power Value was unchecked by default and therefore excluded from the calculation. The count varies by company and by data availability, so it is not a fixed number.
Can I get a refund if I change my mind?
Investing.com states on its own support site that InvestingPro services are provided on a non-refundable basis, and its terms say the same. You can cancel at any time, the subscription then does not renew after the current billing period, and access continues until that period ends. Several affiliate pages describe a 7 day money-back guarantee on annual plans. That wording does not appear in the official terms or the official support article, both checked 10 August 2026, so treat the non-refundable statement as the one that governs and decide accordingly.
Does it cover markets outside the United States?
Yes, and global coverage is its clearest structural advantage over the US focused research platforms. It cuts the other way on ProPicks AI: of the 88 strategies we counted, 10 were filtered to a United States trading region, so most of the strategy catalogue is aimed elsewhere.
Who should skip InvestingPro?
Investors who buy index funds and hold them, anyone who needs live trading data, and anyone who will not open a valuation panel more than a few times a year. The subscription is a fixed annual cost sitting on top of whatever you already pay in fund fees and spreads, and on a small portfolio held passively that is difficult to justify.
How we reviewed this
Access. Platform access was arranged through an affiliate partnership with Investing.com. Investing.com did not review this page before publication, did not see it in draft, and has no approval over its contents.
Method. One logged-in session on 10 August 2026, following a single company, Apple, through every tool in sequence rather than sampling features at random. Apple traded between $313.33 and $306.24 across that session, which is why figures in different screenshots differ by a few dollars.
Evidence. Every screenshot on this page was captured by us and carries its capture date. No vendor marketing imagery is used anywhere. Model counts, strategy counts and screener results were counted by hand rather than taken from marketing copy.
What we left out. Several figures circulate for this product with no consistent source, including subscriber counts, instrument counts and the number of metrics in the screener. Where a figure could not be read at its source, it is not on this page.
Corrections. Anything wrong here gets fixed in public and dated. See the correction log. Prices, screenshots and performance figures are re-checked every 90 days or immediately on any interface change.
Written by Jacob Shasha, who builds and maintains feequity and invests his own money. Not a licensed financial adviser · how we are paid is set out at how we make money · methodology at how we test · last checked 10 August 2026