Home · Research tools · InvestingPro review · ProPicks AI
On this page
Two products share a name. ProPicks AI is the strategy service inside InvestingPro, the premium subscription of Investing.com. An unrelated portfolio management product also called InvestingPro appears on software directories with poor ratings and has nothing to do with this.
Start here, because the order matters
ProPicks AI is a catalogue of rules-based stock strategies. Each one holds a fixed number of positions, rebalances on a schedule, and publishes its returns. We tested it inside a logged-in session on 10 August 2026 as part of our full InvestingPro review and its companion record of marketing claims checked, alongside the same count run on the Stock Analysis free tier, and this page goes deeper on the part that decides whether any of it is worth paying for.
Almost every page written about this product leads with a number in the four figures. That number is real, it is published by Investing.com, and it does not describe money anyone made. Here is the separation, first, before any assessment of whether the service is good.
Backtested and live are different numbers
Take the flagship strategy, Beat the S&P 500. Investing.com publishes two sets of figures for it and labels both.
| Beat the S&P 500 | Figure | What it describes |
|---|---|---|
| Backtested total return | +1,229.0% | Simulated, from 1 Jan 2013 |
| Backtested index return | +443.9% | Same simulated window |
| Backtested outperformance | +785.0% | Simulated |
| Backtested annualised | +21.0% | Simulated |
| Live, one year | +17.8% | Actual, as published |
| Live, five years | +83.7% | Actual, as published |
| Beta | 1.10 | More volatile than the market, not less |

Investing.com's own wording on the strategy page is that the backtest shows how the selections would have performed. Its methodology page calls the flagship chart hypothetical. Its FAQ states plainly that backtested results do not represent actual trades, and adds that backtesting can be adjusted until past returns look optimal, so real world results may differ.
Why this page is not an expose. Investing.com publishes every one of those statements itself, in public, on the same pages that carry the returns. It is more transparent about the limits of its own numbers than most of the sites writing about it. The story here is not that a company hid something. It is that almost every review repeats the four-figure number and skips the label sitting directly underneath it.
The live figure stands on its own. Roughly eighteen percent over one year and eighty-four percent over five, published by Investing.com and observed 10 August 2026, is a result worth having. It does not need the simulated number next to it, and the simulated number makes it harder to believe rather than easier.
Eighty-eight strategies, counted
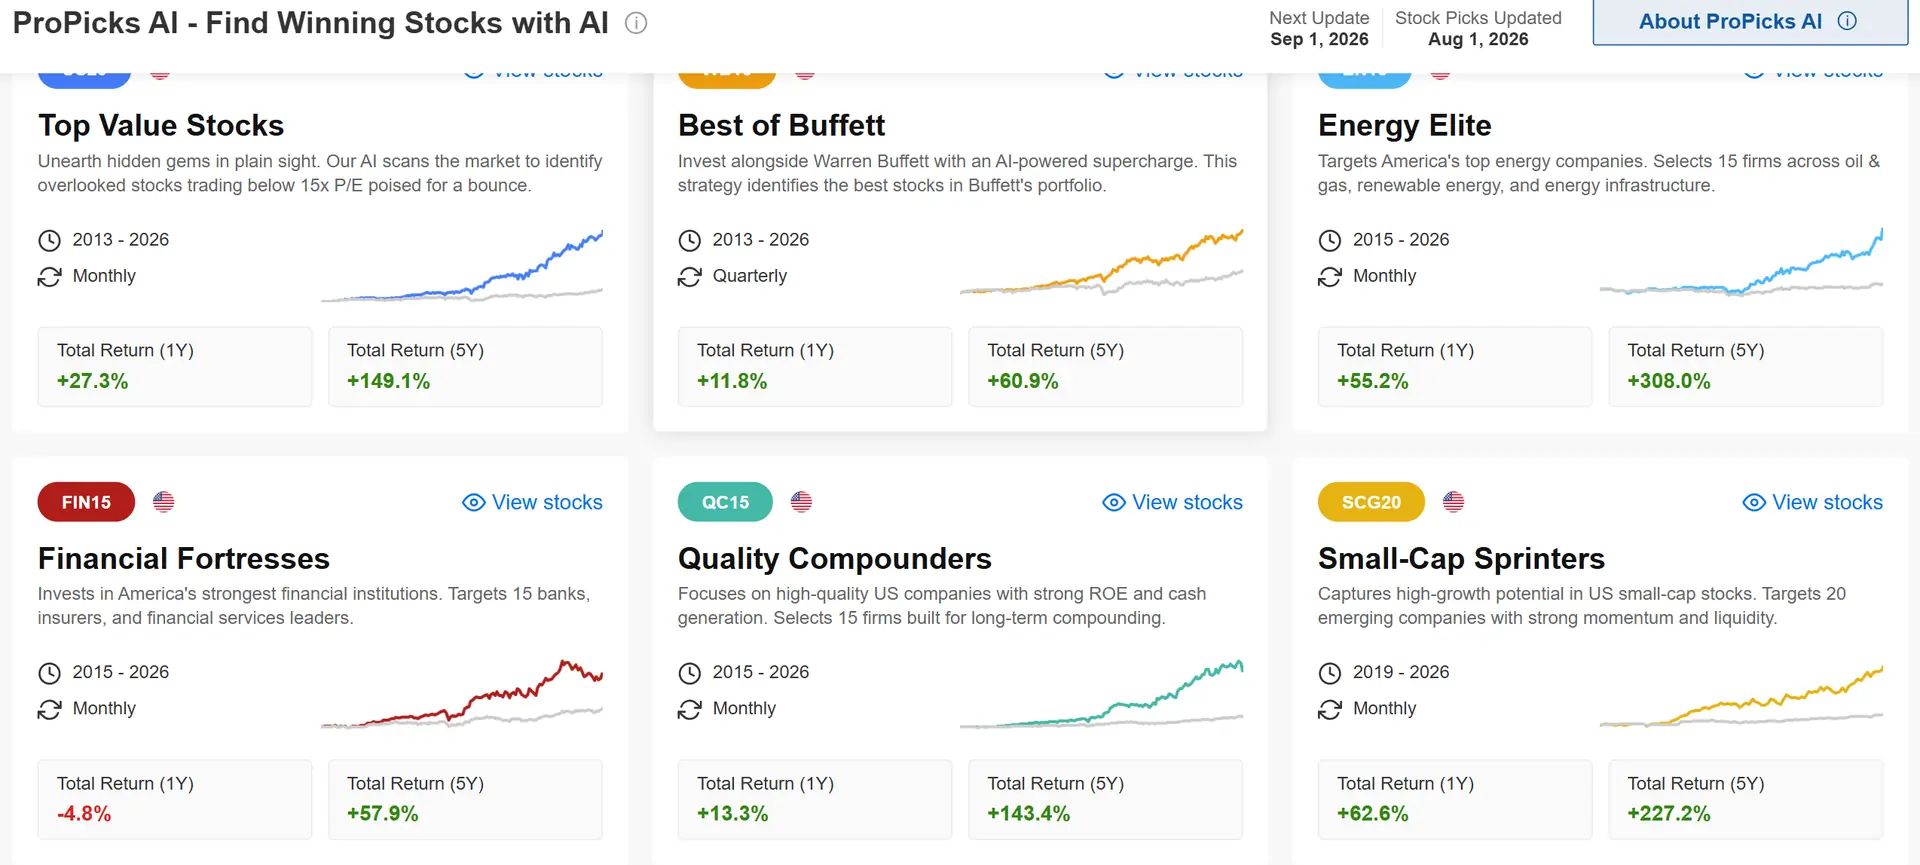
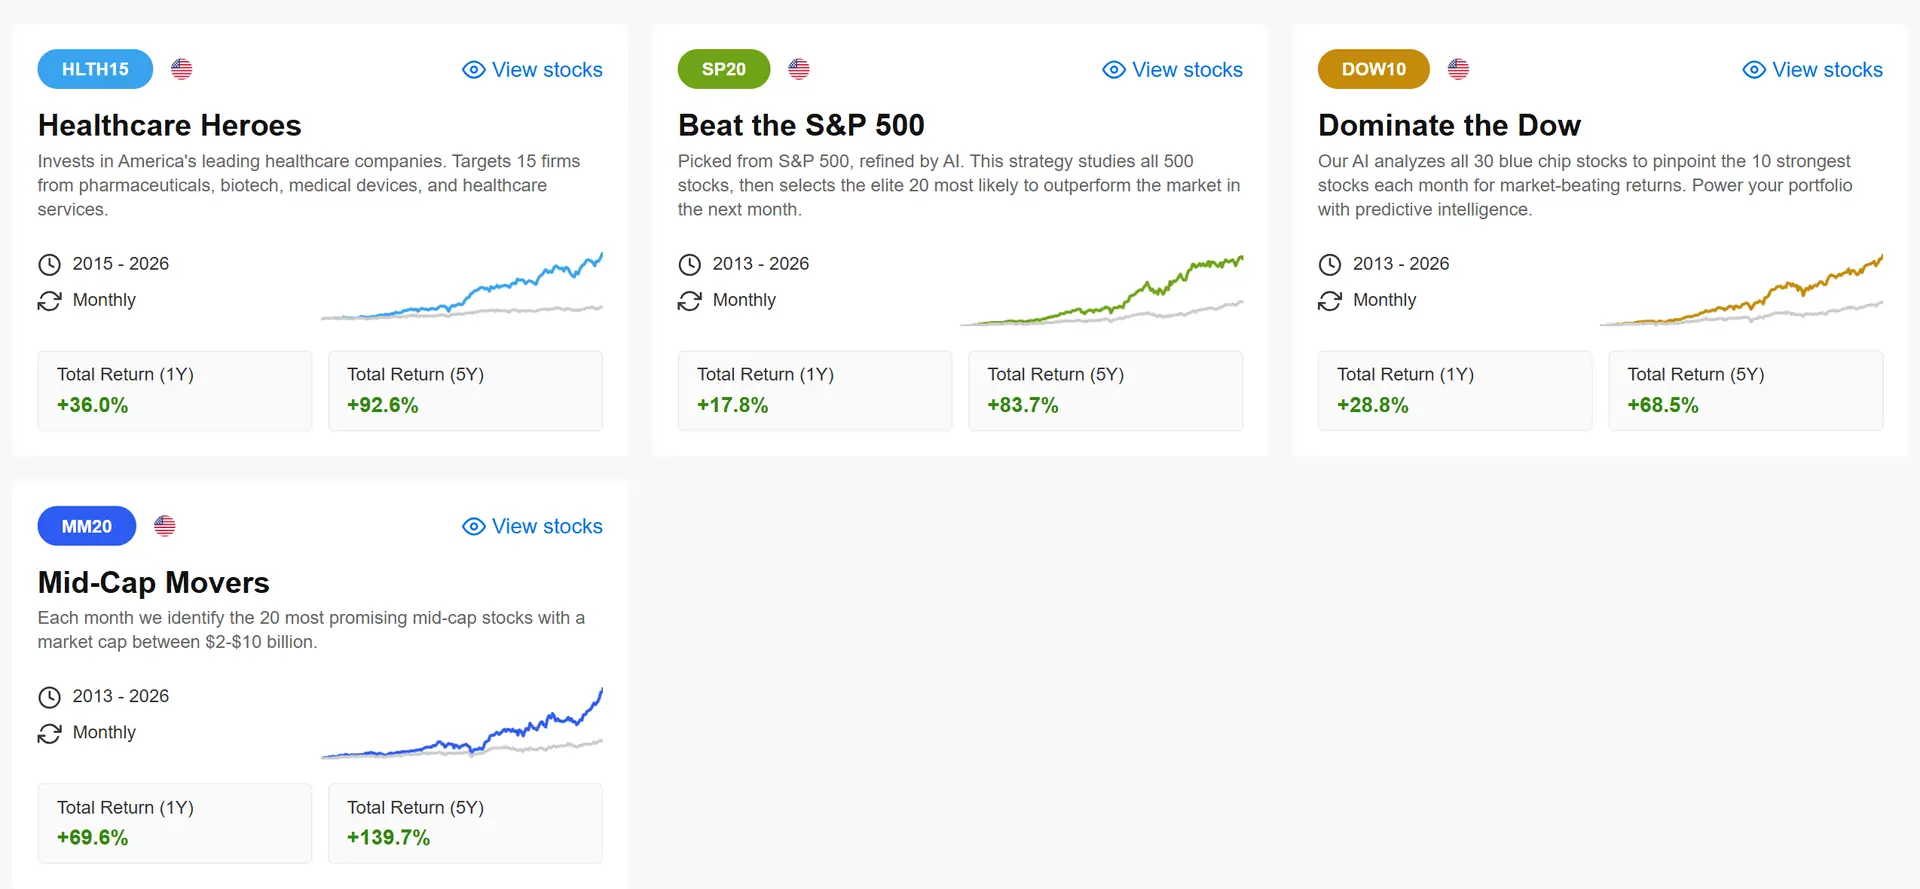
We counted the catalogue rather than taking a marketing figure: fifteen pages of six, giving eighty-eight strategies on the tier tested. Filtering the trading region to the United States returned two pages, six then four, so ten American strategies. The rest target other regions, which cuts both ways depending on where you invest.
The ten US strategies, one year live
This is the table that matters more than the flagship, because it shows the spread. Which strategy you follow decides considerably more than whether you subscribe.
| Strategy | One year |
|---|---|
| Mid-Cap Movers | +69.6% |
| Small-Cap Sprinters | +62.6% |
| Energy Elite | +55.2% |
| Healthcare Heroes | +36.0% |
| Dominate the Dow | +28.8% |
| Top Value Stocks | +27.3% |
| Beat the S&P 500 | +17.8% |
| Quality Compounders | +13.3% |
| Best of Buffett | +11.8% |
| Financial Fortresses | -4.8% |
A seventy-four point spread between the best and the worst, over the same twelve months, inside the same product. One strategy lost money. A subscriber who picked Financial Fortresses and a subscriber who picked Mid-Cap Movers had completely different years and paid the same fee.
Note also that backtest start dates vary by strategy: some run from 2013, others from 2015 or 2019. A strategy showing a shorter simulated history is not necessarily worse, but the periods are not comparable, and the catalogue presents them side by side as though they were.
We get paid if you subscribe. We still printed the strategy that lost 4.8% · 10 Aug 2026
What actually happens each month
Picks updated on 1 August 2026 with the next update dated 1 September, so the cadence is monthly. Turnover is real and it is published, including the losses.
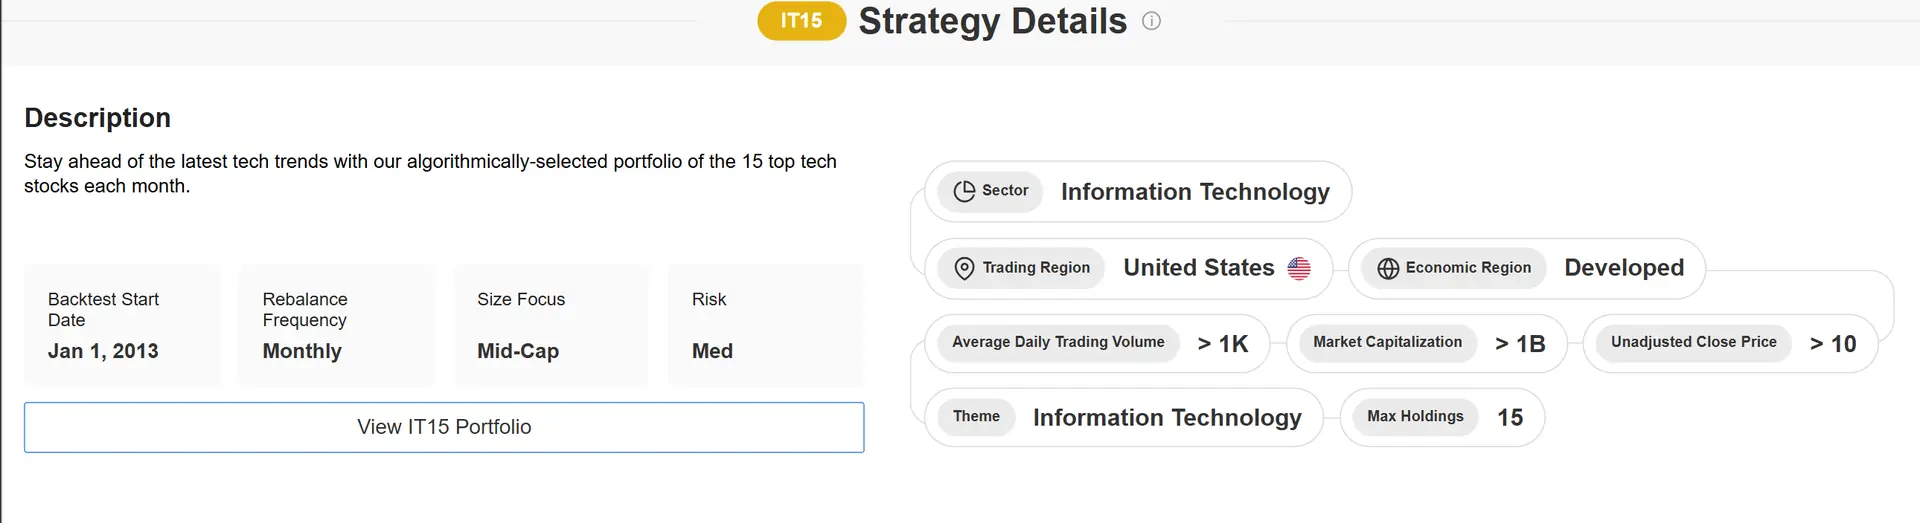
Tech Titans, one of the US strategies, holds a maximum of fifteen positions, rebalances monthly, focuses on mid-cap companies in developed markets, and screens on average daily volume above a thousand, market capitalisation above a billion, and an unadjusted close above ten dollars. In the August 2026 rebalance it added HP Inc and Applied Materials, both marked live, and removed Skyworks at minus five and a half percent and Allegro at minus eleven point nine percent.
Publishing the exits at the price they were closed is the single most reassuring thing on the platform, and it is worth more than any headline return. A service that shows you what it got wrong last month is behaving differently from one that only shows a chart going up.
How the models are built
Investing.com states that its models are trained on Google Vertex AI using more than twenty-five years of purchased financial data and over fifty financial metrics. Its FAQ names the specific problems that afflict this kind of work: survivorship bias, look-ahead and restatement bias, and corporate actions, and it describes what it does to mitigate each. It then concludes that it is impossible to guarantee every bias has been eliminated.
That last sentence is the one to hold onto. It is an accurate statement about all backtesting everywhere, and a vendor writing it down voluntarily is not the behaviour of a company overselling its own numbers.
Paid link. The section below it argues against subscribing · 10 Aug 2026
What it is not, and who it is wrong for
- It is not a portfolio. A strategy holding fifteen positions with monthly turnover is a component, not an allocation. Nothing here tells you how much of your money should be in it.
- It is not advice, and it does not know you. The strategies have no view on your tax position, your other holdings or your time horizon.
- Monthly rebalancing has a cost you pay, not the strategy. Every addition and removal is a trade in your account with a commission and a spread, and in a taxable account, a disposal. The published returns do not carry your costs.
- Most of the catalogue is not American. Ten of eighty-eight strategies filter to a US trading region. If you invest only in US companies, the catalogue is smaller than it looks.
- Following it requires doing nothing for long stretches. The strategy with a negative year is the test. Most people switch after a bad run, which converts a rules-based approach into an emotional one and forfeits the entire premise.
Paid link. The 1,229% and the 17.8% sit in the same table for a reason · 10 Aug 2026
Verdict
ProPicks AI is a competent rules-based strategy service with unusually honest disclosure and one presentational problem: the number it leads with is simulated, and the number that matters is smaller and further down the page. Read it in the right order and it is a reasonable thing to buy. Read it in the order the marketing suggests and you will be disappointed within a year.
Worth it if you want a rules-based component inside a portfolio you already understand, you can leave it alone through a bad twelve months, and you were going to subscribe to InvestingPro for the research tools anyway. In that case ProPicks is an addition to something you are already paying for rather than the reason to pay.
Skip it if you were planning to follow a single strategy with most of your money, if monthly trading costs matter at your account size, or if you would have switched strategies after seeing minus four point eight percent. Those are not edge cases, they are what usually happens.
The other AI product in the same subscription is WarrenAI, the research assistant, which we tested separately across four companies and where we found a reproducible problem worth knowing about: our WarrenAI review sets it out with the screenshots.
For the rest of the platform, the valuation models and the health scoring and the screener, the main review covers what we found in the same session, and the alternatives page sets it against six competitors with prices read at source.
Paid link. No price before checkout, no refund after. Now you know · 10 Aug 2026
Common questions
Are the ProPicks AI returns real?
Both kinds exist and they are labelled. For the flagship Beat the S&P 500 strategy, Investing.com publishes a backtested total return of 1,229.0 percent against 443.9 percent for the index from 1 January 2013, and separately publishes live returns for the same strategy of 17.8 percent over one year and 83.7 percent over five years. Investing.com describes the backtested figures as hypothetical on its own methodology page. Both observed 10 August 2026.
How many ProPicks strategies are there?
We counted eighty-eight in the catalogue on the tier tested, confirmed by paging through fifteen pages of six. Filtering the trading region to the United States returned ten. The number available to you depends on which tier you subscribe to, so check the plan comparison rather than assuming the full catalogue.
How often do the picks change?
Monthly. Picks were updated on 1 August 2026 with the next update dated 1 September. Each rebalance adds and removes positions, and the removals are published with the return at which they were closed, including losses.
Which ProPicks strategy performed best?
Across the ten US strategies over one year, Mid-Cap Movers led at 69.6 percent and Financial Fortresses was the only negative at minus 4.8 percent, a spread of more than seventy points inside the same product. Past performance of a strategy is not a reason to expect the same next year, and choosing a strategy on last year's ranking is the most common way subscribers lose money with a service like this.
Is ProPicks AI financial advice?
No, and Investing.com does not present it as such. The strategies are rules-based selections with no knowledge of your holdings, tax position or time horizon. How much of your money belongs in any of them is a question the product does not attempt to answer.
How we reviewed this
Method. Every figure on this page was observed in a logged-in session on 10 August 2026. Strategy counts were confirmed by paging through the catalogue and counting rather than by repeating a published total. Screenshots are ours and carry their capture date.
Attribution. All performance figures are published by Investing.com and are reproduced here with the label the company applies to them, backtested or live. We did not independently verify the returns themselves, and this page says so rather than implying we did.
Access. Platform access was arranged through an affiliate partnership with Investing.com. Investing.com did not see this page before publication and has no approval over its contents.
Corrections. Anything wrong here gets fixed in public and dated. See the correction log. Figures are re-checked every 90 days or immediately on any published change.
Written by Jacob Shasha, who builds and maintains feequity and invests his own money. Not a licensed financial adviser · how we are paid is set out at how we make money · methodology at how we test · last checked 10 August 2026