Home · Research tools · Stock Analysis free tier
On this page
Short answer
Most research platforms give away a demo. The screener loads, then two clicks in you hit a wall, and the free tier turns out to be a brochure with a search box. We went in expecting that and counted the metrics one by one to find the wall.
In the screener it is not really there. It carries 313 distinct metrics and exactly 14 of them are locked. Everything else filters, sorts and returns results on a free account.
The wall is somewhere else, and it is made of time rather than features. Financial history stops at five years. Inside the operating metrics tables the older columns are replaced with an upgrade prompt, in one case after barely a year. So the honest summary is that the free tier lets you screen the entire market and read any company as it stands today, but not follow one backwards. That is a coherent product decision, and it is the thing to know before you start rather than after.
What this page is. A count taken on 14 August 2026 on a free account, before paying anything. It is not a review of the paid product, because we have not used the paid product. When we do, that will be a separate page with its own dates, and nothing here will be quietly rewritten to match it.
The 14 locked metrics
| Group | What is locked | Reading |
|---|---|---|
| Fair Value | Lynch Fair Value · Graham Number · Lynch Upside · Graham Upside · WACC | Whole category |
| Top Analyst | Top Analyst Rating · Top Analyst Count · Top Analyst Price Target · Top Analyst Price Target Upside | Whole layer |
| Ten year windows | Average PE Ratio (10Y) · Dividend Growth (10Y) · OCF Growth (10Y) | Longest window only |
| Risk ratios | Sharpe Ratio · Sortino Ratio | Both |
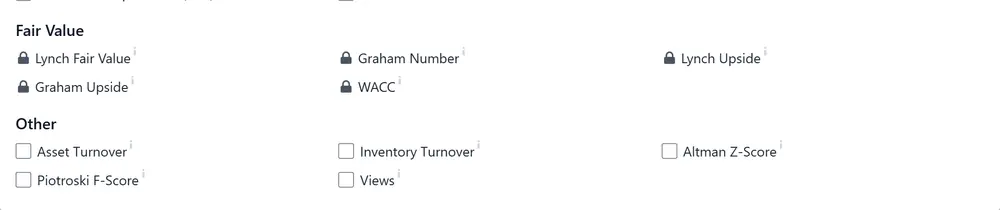
Fair Value is the only category locked in full. The three ten year metrics are the clearest tell in the whole list: the one year, three year and five year versions of each are free, and only the ten year window is gated. The same logic applies to the analyst data, where the ordinary ratings, counts and price targets are free and only the top-analyst layer is held back.
So the paid tier is not selling you the screener. It is selling you longer windows, valuation models, and a filter for which analysts have actually been right.
What 313 metrics means in practice
The full list runs across 29 categories. The largest are the return groups, which between them carry price change, total return and annualised return across windows from one week to twenty years. Valuation and ratios carries 31, including the full set of enterprise value multiples and the free cash flow yields. Cash flow carries 22, and price and volume 26.
Everything ordinary is free. Market cap, all the PE variants, margins, balance sheet strength, short interest, returns on capital, Altman Z-Score and Piotroski F-Score all filter without an account upgrade. Altman and Piotroski being free is worth noting on its own, since both are routinely sold as premium screening features elsewhere.
Stock Analysis's own pricing page advertises 300+ indicators in data tables. Our count of the screener came to 313, which is the first time in this series that a counted figure has landed essentially where the advertised one said it would. Every count we ran against InvestingPro's published figures came out below them.
Coverage outside the United States
We tested three listings on the same day: Apple on NASDAQ, ASML on NASDAQ, and adidas on Deutsche Börse Xetra, the last of these being a German company with no US listing involved.

adidas returns a full company page in euros, with the price, market capitalisation, dividend and analyst target all in the local currency, German regulatory filings in the news feed, and 30 analysts with a target of €202.72. This is not a thin foreign feed bolted onto a US product. The search also returned adidas on Warsaw and Zurich alongside Frankfurt, and the screener carries a dedicated filter for whether a listing is the primary one, which suggests multiple listings were designed for rather than tolerated.
Two things are thinner on the German listing than on the two US ones. There is no operating metrics tab, and trading volume shows as unavailable. The data source line also differs: the US pages cite S&P Global Market Intelligence and CBOE, the German page cites S&P Global Market Intelligence and Financial Modeling Prep, and the operating metrics tables cite TipRanks. Three suppliers behind one product, each named on the page where it is used.
The five year limit applies identically on all three. A German listing is not treated worse on history than the largest company in the world, which is worth stating because the opposite is common.
Where the free tier does stop
Three limits, all found by hitting them rather than by reading about them.
Financial history stops at five years. On a company page the history control offers 5Y, 10Y and Max. Only 5Y loads. Selecting either 10Y or Max sends you to the pricing page instead of returning data, so the free tier gives you five years of financials and nothing beyond it. This is the single hardest limit on the free account and the one most likely to decide the question for you: five years does not cover a full cycle, and it will not show you how a company behaved in 2020.
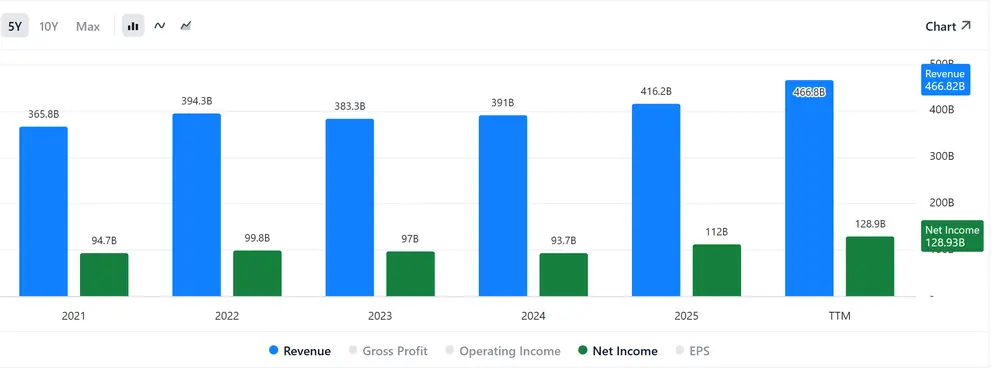
It is also the clearest contrast with the paid tier, which the pricing page describes as 10 to 40 years of financial history. So the paid product is not selling a marginal extension. It is selling the difference between half a decade and, for older companies, four of them. For comparison, InvestingPro caps history at ten years even on its highest tier, which puts the paid tier here well ahead and the free tier here behind.
Advertising. The free tier is ad supported. Removing ads is listed as a paid feature on the pricing page, which at least is stated plainly rather than buried.
The 14 metrics above. They appear in the list with a padlock rather than being hidden, which means you can see exactly what you are not getting before deciding whether it matters. That is a small thing and most vendors get it wrong.
The second set of locks, inside the data
The 14 screener metrics are the visible paywall. There is a quieter one in the operating metrics tables on a company page, where the metric itself is free but the older columns are not. On Apple, checked the same day:
| Table | Free history reaches back to |
|---|---|
| Global Active Devices | January 2017 |
| Revenue by Geography | September 2024 |
| Gross Profit by Type | June 2024 |
| Gross Margin by Type | March 2025 |

Gross Margin by Type is the sharpest case: five quarters of free history and an upgrade prompt in every column before that. The pattern is the same one the five year limit follows, which is that what you are being sold is depth of record rather than breadth of coverage.
It is worth saying that the locked columns are shown rather than hidden. You can see that the data exists, which quarters you are missing, and therefore whether the gap matters to you. Most vendors would simply truncate the table and let you assume that was all there was.
What we checked on a real company
Apple, 14 August 2026, 15:24 New York time, trading at $305.53. Same anchor company we use across the whole research tools section, so the numbers are comparable page to page.
| Figure | As displayed | Note |
|---|---|---|
| FY2025 revenue | $416.16B, up 6.43% | Matches the figure we verified against the filing during our InvestingPro session |
| Trailing twelve month revenue | $466.82B | Different measure, same screen. Worth not confusing with the fiscal year figure |
| Analyst coverage | 46 analysts, target $322.28, upside 5.48% | InvestingPro showed 41 analysts and $322.82 on 10 August. Four days apart, so not necessarily a conflict |
| Five year revenue | 365.8 · 394.3 · 383.3 · 391.0 · 416.2 | FY2021 to FY2025, USD billions. This is the entire history the free tier will show |
The arithmetic on the analyst figure checks out: $322.28 against $305.53 is +5.48%, exactly as displayed. That sounds like a low bar until you have seen a paid research tool state a percentage with the sign inverted, which is what we documented on WarrenAI.
What it costs if you do upgrade
Read from the pricing and activation screens on 14 August 2026. Pro annual is $79 a year, shown as $6.58 a month. Pro monthly is $9.99, which the same screen states plainly as $119.88 a year, with the annual saving printed as $40.88. Unlimited is $16.58 a month billed annually. Showing the monthly plan's true yearly cost next to it is a small thing and most subscription pages avoid it.
As the pricing page describes them, the difference between the two plans is not data but limits: Pro allows one download a day, 100 stocks per watchlist, 100 active alerts and 25 analysts followed, and Unlimited removes each of those caps.
One gap worth flagging. Neither plan mentions Fair Value, Lynch, Graham or WACC anywhere in its feature list, and clicking a locked metric sends you to the pricing page without saying which plan would unlock it. So the five locked valuation metrics are the one thing you cannot establish the price of before paying. We will report which plan actually unlocks them once we have paid for one, and we are not guessing in the meantime.
A 60 day money-back guarantee appears twice on that page, once under each plan. The pricing page also states financial history of 10 to 40 years and dividend history of 10 to 50 years on Pro. Against a free tier that stops at five years, that is the actual product being sold, and it is worth being clear that the ten year view is already behind the paywall rather than sitting at the top of it.
Why we are noting the guarantee. Across this section we score how easy a product is to leave, because it is the part nobody checks before paying. A 60 day window stated on the pricing page itself is unusually long. We have not tested whether it is honoured, and we will not say it works until we have asked for a refund ourselves and recorded what happened.
Who the free tier is enough for
If what you do is screen, the free tier does the job. Fundamentals, ratios, margins, balance sheet strength, returns on capital, short interest, Altman and Piotroski all filter without paying, and that covers a large share of what individual investors actually screen on.
If what you do is study individual companies, it does not. Five years of history is not enough to see a company through a downturn, and the segment tables cut off sooner still. adidas is the example that makes this concrete: the free five year view shows a loss in 2023 and a 71% collapse in net income in 2022, both plainly, without softening. What it cannot show you is 2020, or what the business looked like before any of it started.
You also need the paid tier for Lynch or Graham style fair value estimates, for filtering by top-performing analysts, and for regular exports.
What you should not do is pay for it as an InvestingPro alternative without checking the free tier first, because there is a real chance the free tier already covers your use case. That is not something we can say about most products in this category. We counted two other free tiers the same way on the stock analysis tools comparison, and all three stop in different places.
Common questions
Is Stock Analysis free?
Yes, and substantially so. A free account gives you the full stock screener with 299 of its 313 metrics filtering normally, complete company pages for US and international listings, analyst ratings and price targets, operating metrics by segment and geography, and five years of financial statements. The free tier is ad supported and does not require a paid plan to be useful. What it does not give you is depth of history, which is where the paid tier starts.
How many years of financial history does the free version show?
Five. On a company page the history control offers 5Y, 10Y and Max, and only 5Y returns data. Selecting either of the other two sends you to the pricing page. Checked on 14 August 2026 on Apple, ASML and adidas, with identical behaviour on all three, so this is a property of the free tier rather than of any one company. The paid tier is advertised at 10 to 40 years.
Which screener metrics are locked on the free plan?
Fourteen, counted individually on 14 August 2026. The whole Fair Value category, meaning Lynch Fair Value, Graham Number, Lynch Upside, Graham Upside and WACC. The four Top Analyst metrics, covering rating, count, price target and upside. The ten year windows of Average PE Ratio, Dividend Growth and OCF Growth, while the one, three and five year versions of each stay free. And the Sharpe and Sortino ratios. Everything else filters on a free account, including Altman Z-Score and Piotroski F-Score.
Does Stock Analysis cover stocks outside the United States?
Yes, and not only through American depositary receipts. adidas on Deutsche Boerse Xetra, a German company with no US listing involved, returns a full page priced in euros with German regulatory filings in the news feed and 30 analysts covering it. The same search returned adidas on Warsaw and Zurich as well. Two things are thinner on the German listing than on a US one: there is no operating metrics tab, and trading volume shows as unavailable.
How much does Stock Analysis Pro cost?
Pro is $79 a year, displayed as $6.58 a month, or $9.99 billed monthly. The activation screen states the monthly plan as $119.88 a year and prints the annual saving as $40.88, which is more candid than most subscription pages manage. Unlimited is $16.58 a month billed annually. Read from the pricing and activation screens on 14 August 2026.
Is there a free trial, and can you get a refund?
There is no free trial in the usual sense, because the free tier is permanent rather than time limited. Instead the pricing page carries a 60 day money-back guarantee, shown once under each plan. We have not tested whether it is honoured and will not say that it works until we have requested a refund ourselves and recorded what happened.
How this was checked
One session on a free account, 14 August 2026, no payment made and no relationship with the company. Screener metrics were counted by opening the full filter list and counting each entry and each padlock individually. Limits were found by attempting the action, not by reading the feature list. Prices and refund terms were read on stockanalysis.com's own pages the same day.
Ownership is disclosed by the company itself: stockanalysis.com is owned by Vefir ehf., a company registered in Iceland, with Paddle as the merchant of record for subscriptions and refunds. Method in full at how we test, access recorded at the access log, and commercial relationships, of which there are none with this company, at how we make money.
All dated figures here are re-checked on a 90 day cycle.
Start with the cost, not the features
Before you pay for research at all, work out what your broker already charges you each year. It is usually the larger number.
Get the free spreadsheet