Home · Research tools · Stock analysis tools
On this page
- Short answer
- How this was counted
- Three tools, three completely different walls
- Finviz: everything visible, nothing exportable
- Stock Analysis: the deepest screener, the shallowest history
- Simply Wall St: the only global one, and the only one that interrupts you
- The coverage test that separates them
- Three answers to the same valuation question
- What each one costs, and what the free tier is really selling
- Which one you should actually open
Short answer
If you screen the whole market and never leave the browser, use Finviz. It shows every result with no row cap and locks almost nothing, then charges you the moment you try to take the data out.
If you want depth on a single company and you follow anything listed outside the United States, use Stock Analysis. Its screener is the deepest of the three by a wide margin, and its free history is the shallowest.
If you want a verdict rather than a table, use Simply Wall St. It is the only one of the three that covers a Frankfurt listing with no US line at all, and the only one that stops you mid-page to ask for an email.
What none of them tells you on the pricing page is the thing that actually decides it, which is where the free tier ends. Those three points are in three completely different places.
What this page is not. It is not a ranking, and there is no winner. Three products drew their paywall in three different places, which means the right one depends entirely on what you do. It is also not a review of the paid tiers. We have not paid for any of these, and where we describe a paid feature it comes from the vendor's own pricing page with the date attached.
How this was counted
Every figure below came from opening the product and counting, not from a feature list. Sessions ran between 14 and 16 August 2026, on free accounts or with no account at all, and each tool was put through the same three companies:
- Apple, NASDAQ. The anchor company we use across the whole research tools section, so the numbers stay comparable page to page.
- ASML, NASDAQ. A European company with a US listing, which is the easy case.
- adidas, Deutsche Boerse Xetra. A German company with no US listing involved, which is the case that actually separates these tools.
Where a limit is stated, it was found by hitting it rather than by reading about it. That distinction matters: two of the three describe their free tier accurately on the pricing page, and the third does not describe the limit that most readers will meet first.
Three tools, three completely different walls
This is the finding. Every roundup of stock analysis tools compares features. Almost none of them compares where the free version stops, which is the only thing that determines whether you will ever pay.
| Tool | What the free tier stops you doing | What it does not restrict |
|---|---|---|
| Finviz | Taking data out. Export and API are behind Elite entirely. | Reading. All 11,566 results across 579 pages, no account needed. |
| Stock Analysis | Looking backwards. Financial history stops at five years. | Screening. 313 metrics, of which only 14 are locked. |
| Simply Wall St | Reading on. A sign-up modal interrupts the report partway down. | Coverage. The full report exists for listings the other two do not carry. |
Read that table again with your own habits in mind, because it answers the question faster than any feature comparison will. A screener who exports to a spreadsheet every week will hit the Finviz wall on day one and never notice the other two. Someone studying one company through a full cycle will hit the Stock Analysis wall immediately and find Finviz perfectly adequate.
Finviz: everything visible, nothing exportable
Counted 15 August 2026 on a free logged-in account.
| Measure | Free tier |
|---|---|
| Screener filters | 73 in the All tab, of which 2 are locked (Trades, News Keywords). Counted per tab it is 79, so the tabs overlap |
| Display columns | 128 across 12 categories, none locked |
| Metrics on a company page | 84, of which 1 is locked |
| Screener universe | 11,566 instruments |
| Results shown | All 579 pages. No row cap found. |
| Financial statements | 6 years on Apple, 7 on ASML |
| Quote delay | 1 minute for NASDAQ, NYSE and AMEX. 20 minutes on futures pages |
| Export and API | Locked |
| Advertising | Yes |

The quote delay is the figure everyone has wrong, and the reason why is more interesting than the error. Search for a Finviz review and you will be told the free tier is delayed by up to 20 minutes. Google's own AI overview says it. So does the most-viewed video review, and so does the largest review site on the results page.
Finviz publishes two different delays on its own site, depending on what you are looking at:
| Page type | Footer, read 15 and 16 August 2026 |
|---|---|
| Stock pages | Quotes delayed 1 minute for NASDAQ, NYSE and AMEX |
| Futures pages | Futures quotes delayed 20 minutes |
So the reviews are not wrong so much as out of date on one half of the product. Twenty minutes is still correct for futures. For stocks it is now one minute, and nobody appears to have noticed the change. That matters because the real-time gap was one of the main reasons to buy Elite. Unless you trade intraday, that argument has largely evaporated, and what is left is export, the API and extended-hours data.
On the filter count. Several widely cited sources, including Google's AI overview, put the Finviz screener at 67 filters. We could not reproduce that figure in any combination. The All tab showed 73 on 15 August 2026. Counting each tab separately gives 22 in Descriptive, 37 in Fundamental and 20 in Technical, which comes to 79 and means the tabs overlap. We publish our count with the date and the method attached rather than asserting that anyone else is wrong, and if someone can show how 67 is reached we will correct this and say so at corrections.
The trade-off is coherent and unusually clean. Finviz gives away the reading and charges for the taking. If your workflow ends in the browser, the free tier is close to complete. If it ends in a spreadsheet, you will pay on the first day.
Stock Analysis: the deepest screener, the shallowest history
Counted 14 August 2026. We have a full page on this one with the complete lock list.
| Measure | Free tier |
|---|---|
| Screener metrics | 313 across 29 categories, of which 14 are locked |
| What is locked | The whole Fair Value category, the four Top Analyst metrics, three ten-year windows, Sharpe and Sortino |
| Financial history | 5 years. 10Y and Max both redirect to pricing |
| Second limit | Segment tables gate older columns. Gross Margin by Type was readable back only to March 2025 |
| Coverage | Global, including Xetra, Warsaw and Zurich |
| Export | Locked. Pro allows one download a day |
Four times the screener depth of Finviz, and it is not close. The pattern in what is locked is worth reading, because it is not arbitrary: the one, three and five year versions of a metric are free and only the ten year version is gated, and ordinary analyst ratings are free while the top-analyst layer is not. What you are being sold is length of record, not breadth of data.
Five years is the hardest limit any of the three imposes on ordinary reading. It is enough to see that something happened and not enough to understand it. On adidas the free view shows a loss in 2023 and a 71% collapse in net income in 2022, both plainly and without softening, but it cannot show you 2020 or what the business looked like before any of it started.
Simply Wall St: the only global one, and the only one that interrupts you
Counted 16 August 2026, in a private window with no account.
| Measure | Free tier |
|---|---|
| Report access | Full eight-section report loads with no account |
| The actual wall | A sign-up modal appears partway down the page, around the community narratives |
| Stated free limit | 5 company reports a month, 1 portfolio with 10 holdings, 5 watchlists |
| Screener | Filters run, but results only activate when the set is under 350 companies |
| Data timeframes | Company financials 10 years, market prices 30 years, ownership 10 years |
| Trial | 7 days of Premium, no card required |
| Export | Locked on Free and on Premium. Only Unlimited unlocks it |
The published limit and the practical limit are different, and this is the one place where a pricing page misleads by omission. The plans page says five company reports a month. What you meet first is a modal, partway down your first report, headed sign up for free and continue analysing this company. Nothing on the pricing page prepares you for that.
Two things about it are better than the category norm, though. The trial is seven days of Premium with no credit card, which neither of the others offers: Finviz requires a card for its seven day Elite trial and bills automatically at the end. And the data sources are published in a table with a timeframe for each type, naming S&P Global Market Intelligence and specifying that 40 of the 88 analysts covering Apple actually contribute estimates.
One line in the sign-up modal is worth noting for what it says about how the company is regulated: Simply Wall St states that it provides general investment advice. That is a different posture from the products that state they provide none, and it is a real distinction rather than a wording preference.
The coverage test that separates them
ASML is the easy case. It is a Dutch company with a NASDAQ listing, so every tool that covers US exchanges covers it. All three returned a full page.
adidas is the case that matters. It trades on Deutsche Boerse Xetra with no US listing in the picture.
| Tool | adidas on Xetra | Any thinning? |
|---|---|---|
| Simply Wall St | Full report in euros, 63 analysts, European peers | None. Identical structure and sources to the Apple report |
| Stock Analysis | Full page in euros with German regulatory filings, 30 analysts | Yes. No operating metrics tab, volume unavailable, different data supplier |
| Finviz | Not present. Searching ADS returns ten US listings, none of them adidas | n/a |
Finviz publishes that it covers NYSE, NASDAQ and AMEX, so this is a stated scope rather than a gap. But it is the single fact most likely to decide the question for a reader outside the United States, and it appears in almost no roundup, because almost no roundup checks a company that has no US line.
Three answers to the same valuation question
Ask these tools what Apple is worth and you get three structurally different kinds of answer. This is the part of the comparison that a feature table cannot express.
| Tool | Fair value for Apple | What kind of number that is |
|---|---|---|
| Simply Wall St | US$253.43, marked 20.7% overvalued, with an Edit Fair Value control | One community member's estimate, shown by name, which you are invited to override |
| InvestingPro | $267.86 | The average of 14 models the platform ran, from $204.85 to $293.22 |
| Stock Analysis | Not shown | The entire Fair Value category is locked on the free tier |
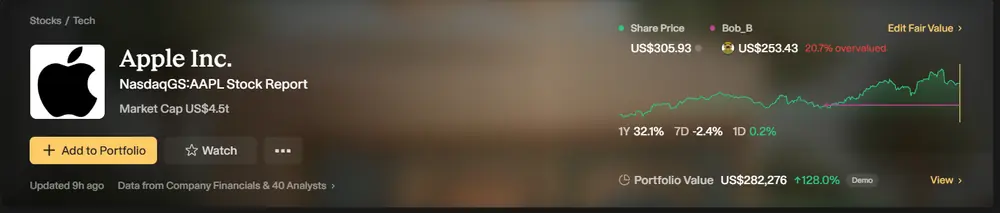
Simply Wall St also shows the spread of what its members think, which on Apple was 1,663 estimates ranging from roughly US$60 to US$390. That range is more honest than a single figure, and it is the opposite of how most tools present valuation. Whether a crowd estimate is better or worse than a model average is a question we are not going to settle here, but you should know which one you are looking at, and the interface does not always make that obvious.
What each one costs, and what the free tier is really selling
Read from each vendor's own pricing page, 15 to 16 August 2026.
| Tool | Paid tier | Trial |
|---|---|---|
| Finviz Elite | $39.50 a month | 7 days, card required, bills automatically at the end |
| Stock Analysis Pro | $79 a year, or $9.99 a month stated as $119.88 a year | None. 60 day money-back guarantee instead |
| Simply Wall St | Premium $10.95 a month, $131.40 yearly. Unlimited $21.50 a month, $258 yearly | 7 days of Premium, no card |
Two of the three publish their price plainly, which is worth saying because it is not universal in this category. Stock Analysis goes further and prints the monthly plan's true annual cost of $119.88 next to the $79 annual option, along with the $40.88 saving. Most subscription pages avoid that arithmetic.
The thing to notice across the whole table is what is being sold. Finviz sells export. Simply Wall St sells export too, and holds it back even from Premium subscribers paying $131.40 a year. Stock Analysis sells length of history. None of the three is really selling access to the data.
On what we have not tested. We have not paid for any of these and cannot tell you whether the paid tiers deliver. We also have not tested any refund or cancellation process, so where a guarantee is mentioned above it is the vendor's published wording and nothing more. Getting out is worth 15% of the score in our comparison methodology, and we do not have first-hand evidence for it on any of these three yet.
Which one you should actually open
Open Finviz if you screen broadly and read in the browser. Seventy-three filters is fewer than the alternatives but covers everything ordinary, no result is hidden behind a row cap, and a one minute delay is real-time enough for anyone not trading intraday. You will hit the wall the first time you try to export.
Open Stock Analysis if you screen on fundamentals in detail, or if you hold anything listed outside the United States. Three hundred and thirteen metrics is the deepest free screener of the three by a factor of four. You will hit the wall the first time you want more than five years of history, which for most serious research is quickly.
Open Simply Wall St if you want a structured verdict on a company rather than a table to interpret yourself, or if you follow European or Asian listings that the other two thin out or drop entirely. You will hit the wall partway down your first report.
And if you are choosing between these and a paid research subscription, the honest answer is that the free tiers here cover a large share of what a paid platform does. What paid tools add is depth of history, valuation models, and export. Two of those three are exactly what the free tiers on this page hold back, which is not a coincidence.
Start with the cost, not the tools
Before you pay for any research subscription, work out what your broker already charges you each year. It is usually the larger number, and no research platform is incentivised to show it to you.
Get the free spreadsheetCommon questions
What is the best free stock analysis tool?
There is no single answer, because the three we counted stop in three different places. Finviz is the best if you read in the browser: 73 screener filters with only 2 locked, all 11,566 results visible with no row cap, and a one minute quote delay. Stock Analysis is the best for screening depth, with 313 metrics of which 14 are locked, but its free financial history stops at five years. Simply Wall St is the best for coverage outside the United States and the only one of the three that returns a full report for a Frankfurt listing with no US line. Counted 14 to 16 August 2026.
Is Finviz free version good enough?
For reading and screening, yes, and more so than most reviews suggest. Of 73 screener filters only 2 are locked, all 128 display columns are open, a company page shows 84 metrics with a single padlock, and every one of the 11,566 results is reachable across 579 pages without an account. The footer now states a one minute quote delay rather than the 15 or 20 minutes that older reviews describe. What is locked is export and the API, so if your workflow ends in a spreadsheet you will pay on day one. Checked 15 August 2026.
Which stock analysis tool covers non-US stocks?
Simply Wall St and Stock Analysis both do. Finviz does not: it publishes that it covers NYSE, NASDAQ and AMEX, and searching for adidas returns ten unrelated US listings. On adidas, listed on Deutsche Boerse Xetra with no US line, Simply Wall St returned a full report in euros with 63 analysts and European peers, structurally identical to its Apple report. Stock Analysis returned a full page in euros with German regulatory filings and 30 analysts, but without an operating metrics tab, without volume data, and from a different data supplier. Checked 15 and 16 August 2026.
Does Simply Wall St have a free trial?
Yes, seven days of Premium, and it does not ask for a credit card. Signing in with a Google account was enough. That is unusual in this category: Finviz also offers a seven day Elite trial but requires a card and starts billing automatically when the trial ends. Stock Analysis offers no trial at all and instead publishes a 60 day money-back guarantee. We have not tested any refund or cancellation process on any of the three. Checked 16 August 2026.
How many years of financial history do these tools show for free?
Finviz showed six years of financial statements on Apple and seven on ASML, so the depth varies by company rather than sitting at a fixed ceiling. Stock Analysis stops at five years, with both the ten year and maximum views redirecting to its pricing page, and its segment tables cut off sooner still. Simply Wall St publishes a data sources table stating ten years of company financials and thirty years of market prices, though market prices and financial statements are different things and the report interrupts you with a sign-up modal before you get far. Checked 14 to 16 August 2026.
Is Finviz free data delayed by 20 minutes?
Not for stocks, as of 16 August 2026. Finviz publishes two different delays on its own site: the footer on stock pages reads one minute for NASDAQ, NYSE and AMEX, while the footer on futures pages reads 20 minutes. Most reviews in circulation, including Google's AI overview, report 20 minutes for the whole product, which is still correct for futures and out of date for stocks. This matters because the real-time gap was one of the main reasons to buy Elite at $39.50 a month, and for anyone not trading intraday that argument has largely gone.
How this was checked
Three sessions between 14 and 16 August 2026, on free accounts or with no account at all, each tool put through Apple, ASML and adidas. Screener metrics and padlocks were counted individually rather than read off a feature list. Limits were found by attempting the action. Prices were read on each vendor's own pricing page on the date shown.
We have no commercial relationship with Finviz, Stock Analysis or Simply Wall St, and none of the links to them on this page earns us anything. Where InvestingPro is mentioned, we do have a partner relationship, disclosed on how we make money and recorded on the access log. Method in full at how we test. All dated figures here are re-checked on a 90 day cycle.
If any of these tools has changed since the date on a figure, we would rather hear about it than have it sit here wrong. Corrections get published and dated at corrections.